


Visualizing Brand Preference: Athletic Shoes
Posted on Feb 14, 2017 by Admin
In previous blog entries, we highlighted the value of having a mapping application to complement premium data when analyzing America's geographic preferences in credit cards, and mayonnaise brands. This week we’ll take a look at athletic shoe brand preference in the US for adults 18+.
Similar to the previous entries, we will use the SimmonsLOCAL data set to put these maps together. If your institution does not currently subscribe to the SimmonsLOCAL package, feel free to reach out to us about setting up a free 30-day trial. Let’s get started.
The maps below can each be generated in less than a minute! Open up the Variables panel, and find the variables in question at this path: SimmonsLOCAL » APPAREL » SHOES/ FOOTWEAR » SHOES/ FOOTWEAR - BRANDS.
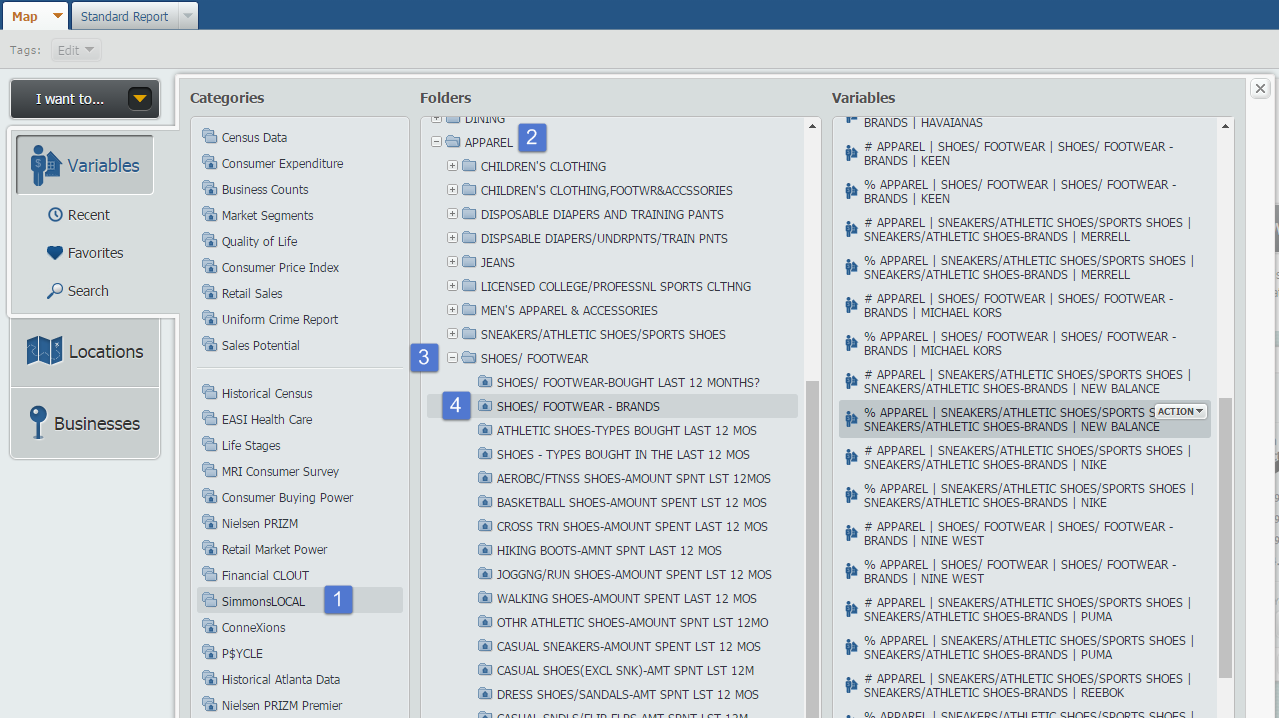
Click on the variable you are interested, and close out the panel to automatically generate a map of the United States. Results for 3 different brands below!
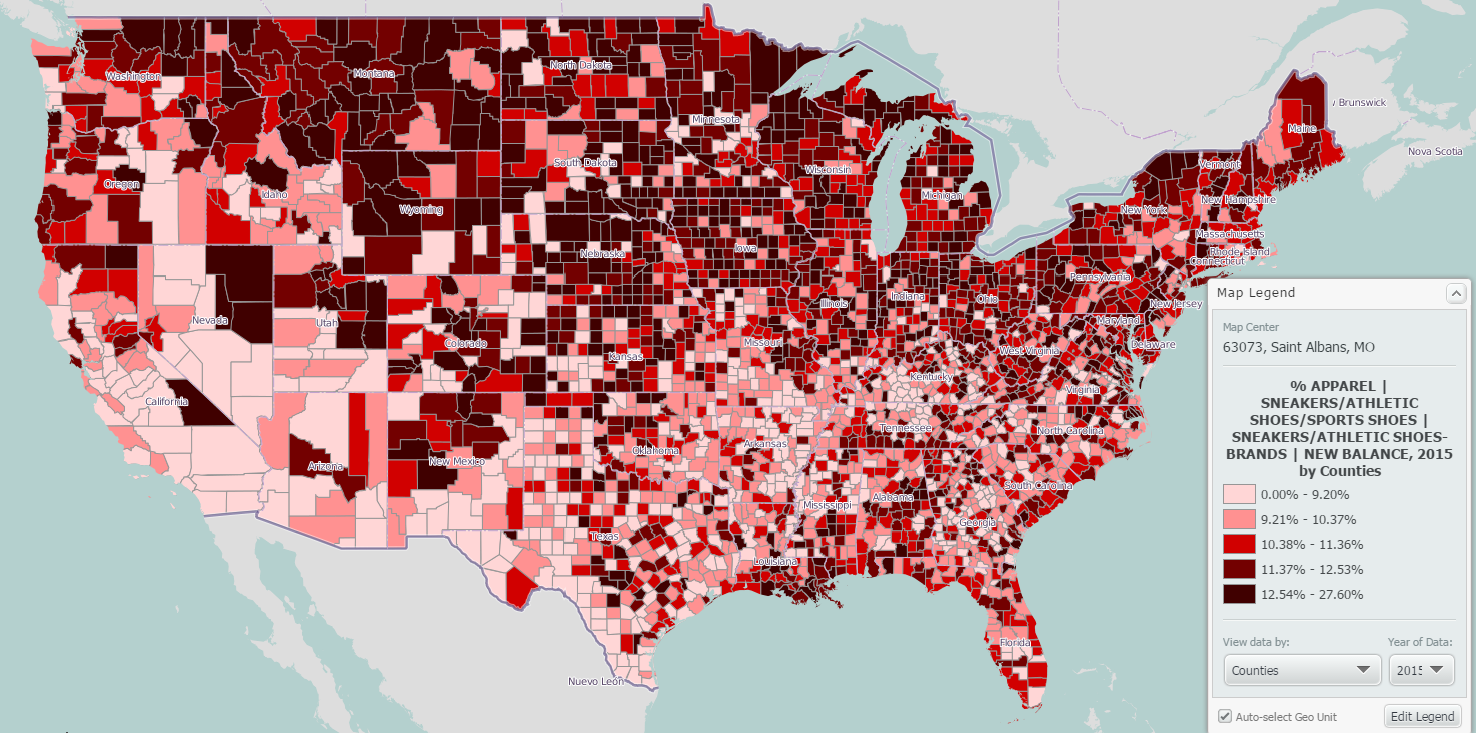
New Balance
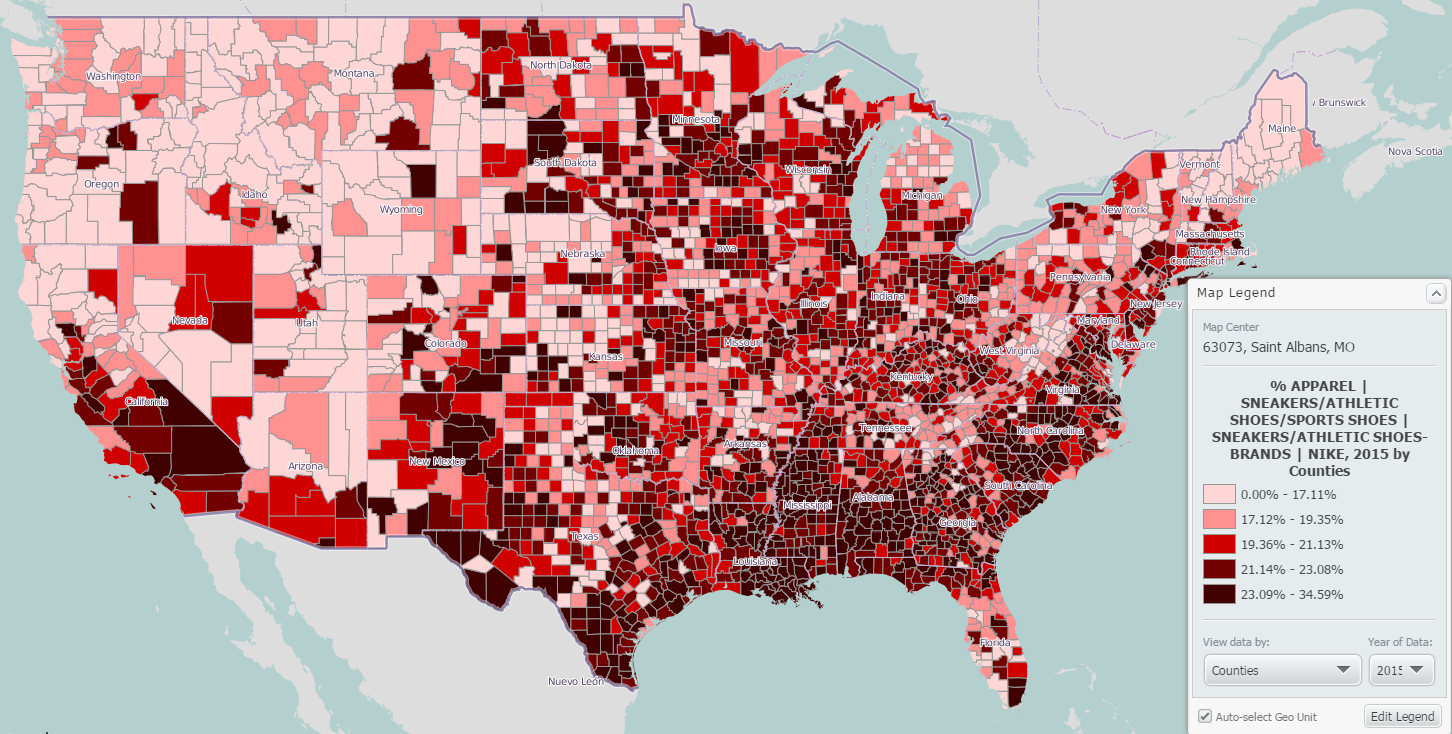
Nike
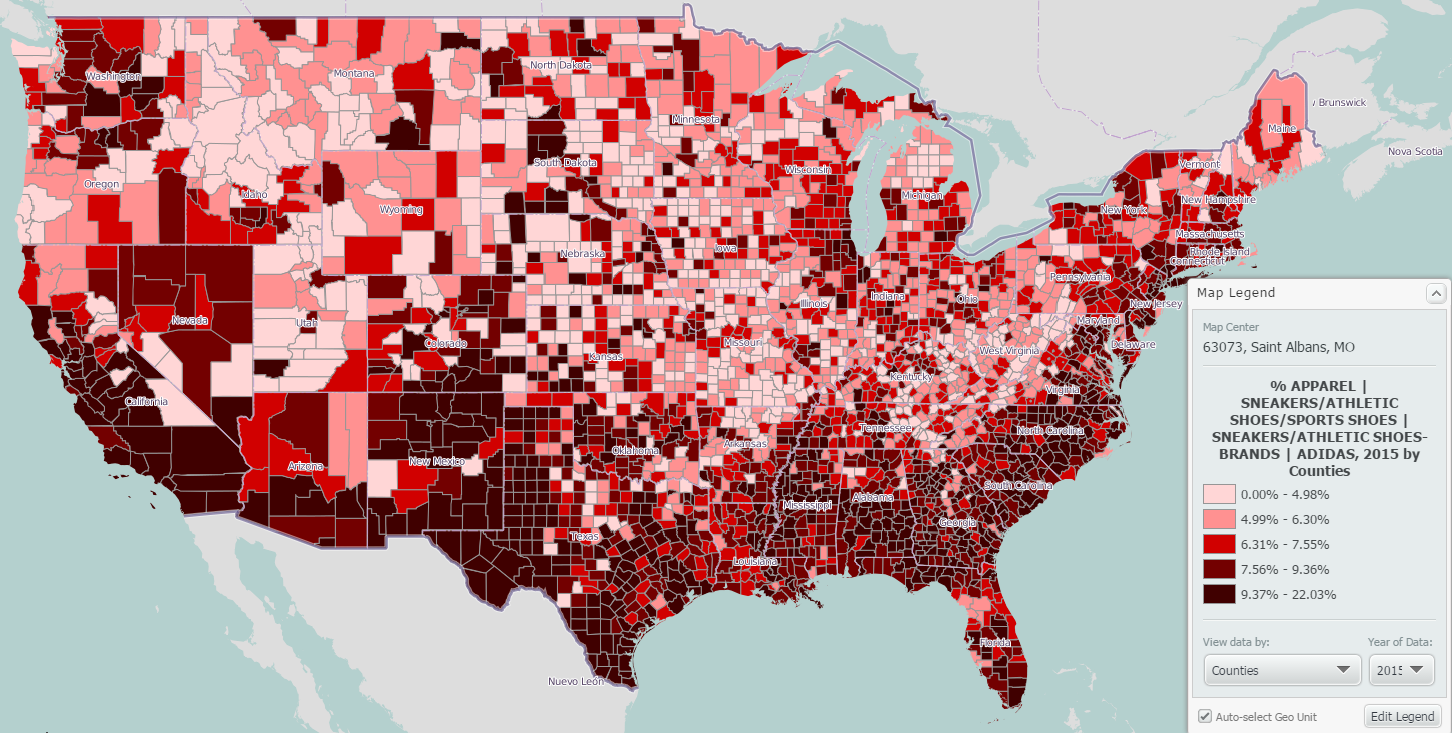
Adidas
A few interesting takeaways from these maps:
1. New Balance is popular amongst the northern half of the US
2. Folks in the south east love their Nikes
3. Adidas dominates the southern portion of the US, including the south west
Can you think of any other brands of items you would like to see mapped? The SimmonsLOCAL data set contains 8,000 specific brands, it is very possible that we have the data you are looking for. Let us know in the comments below!
More from SimplyAnalytics
Posted on Oct 26, 2016 by Admin
In this week’s SimplyMap report, we’ll take a look at the tags feature and demonstrate how it can be useful for you as you work in SimplyMap. SimplyMap users can have up to 20 tabs open i...
Posted on Apr 30, 2024 by Admin
Congratulations to Brandyn Whitaker as the recipient of the 2024 BRASS Student Travel Award! Brandyn is a Library Services Associate in the Workforce and Economic Development department a...
Posted on May 16, 2022 by Admin
Hello readers! We hope you are having a wonderful day. Today we feature a question from the help desk that we think many users would find useful. Let’s get started. The question: How can ...
Posted on Dec 09, 2014 by Admin
In this week’s SimplyMap blog post, we set out to discover which large US cities spend the most money per year on their pets. To find this out we used the variable, “Pets, Household Avera...
Posted on Feb 05, 2015 by Admin
Our Winter Sweepstakes has begun! Enter to win an iPad Mini 3 or Kindle Fire. How to Enter: Follow @SimplyMap on Twitter Like our SimplyMap Facebook Page for a 2nd Chance to Win If you ...
Posted on Jan 12, 2020 by Admin
Happy New Year! SimplyAnalytics will be exhibiting at the ALA Midwinter meeting, held this year at the Pennsylvania Convention Center in Philadelphia on January 24th-27th. If you attend, ...
Posted on Jun 21, 2019 by Admin
Come visit the SimplyAnalytics booth (#3010) at the upcoming ALA 2019 show in Washington, D.C.! Our team will be on hand offering quick demos of SimplyAnalytics, answering questions and s...
Posted on Feb 25, 2020 by Admin
SimplyAnalytics will be exhibiting at the PLA Conference, held this year at the Music City Center in Nashville, TN on February 26 - 28. Visit the team at Booth 1444 with your questions, f...
Posted on May 06, 2013 by Admin
The GRI team is looking forward to exhibiting at SLA 2013 at the San Diego Convention Center, June 9th through the 11th. The Special Libraries Association (SLA) is a nonprofit global orga...
Posted on May 02, 2016 by Admin
Inspired by a recent support desk question, this week’s SimplyMap report will demonstrate how a user would run a business search that consists of multiple names. In short, the user was at...