


Exploring SimplyMap Data: Consumer Buying Power
Posted on Apr 21, 2015 by Admin
In this week’s edition of exploring SimplyMap data, we spotlight the Consumer Buying Power® data package in SimplyMap.
What is it? The Nielsen Consumer Buying Power® database incorporates geography-based estimates of potential annual consumer spending for more than 350 household expenditure items.
This effectively allows researchers to determine a target area for potential consumers or buyers of a given type of product. Let’s take a look at an example.
Scenario: You want to identify target cities in Florida that would be most interested in home cooking products and appliances.
Using the CBP dataset, we can easily locate some target cities. Here’s how:
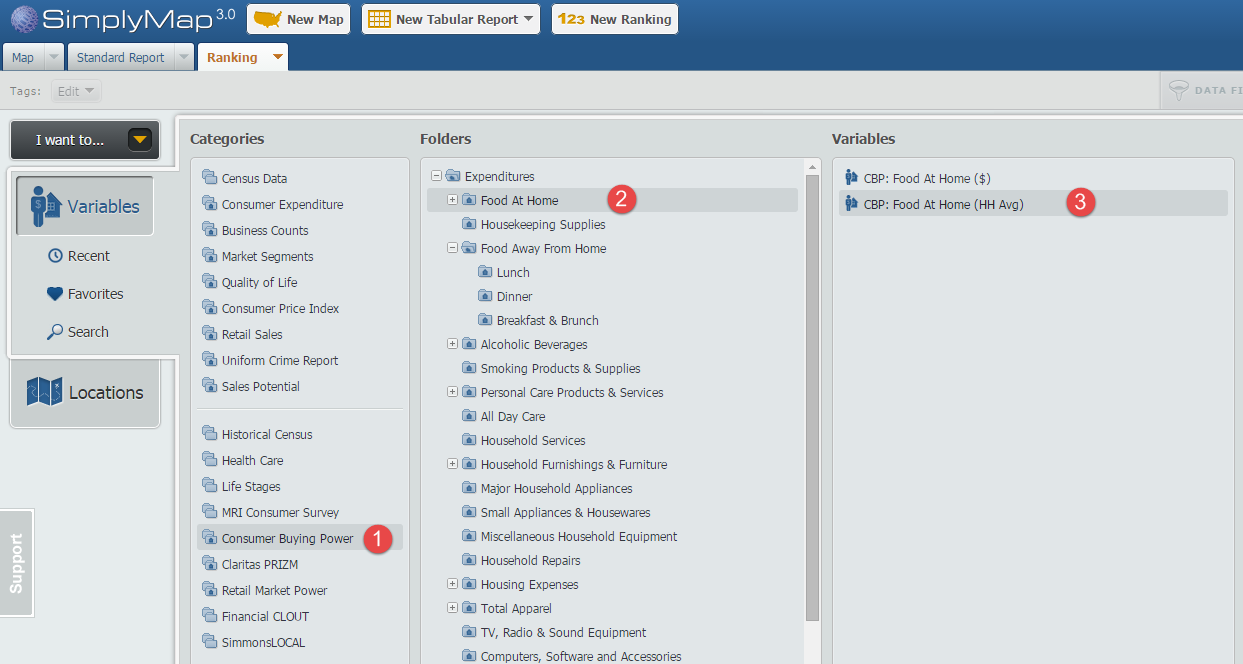
First, create a ranking report using Florida as the location. Next, navigate through the following path to select the variable, CBP: Food At Home (HH Avg).
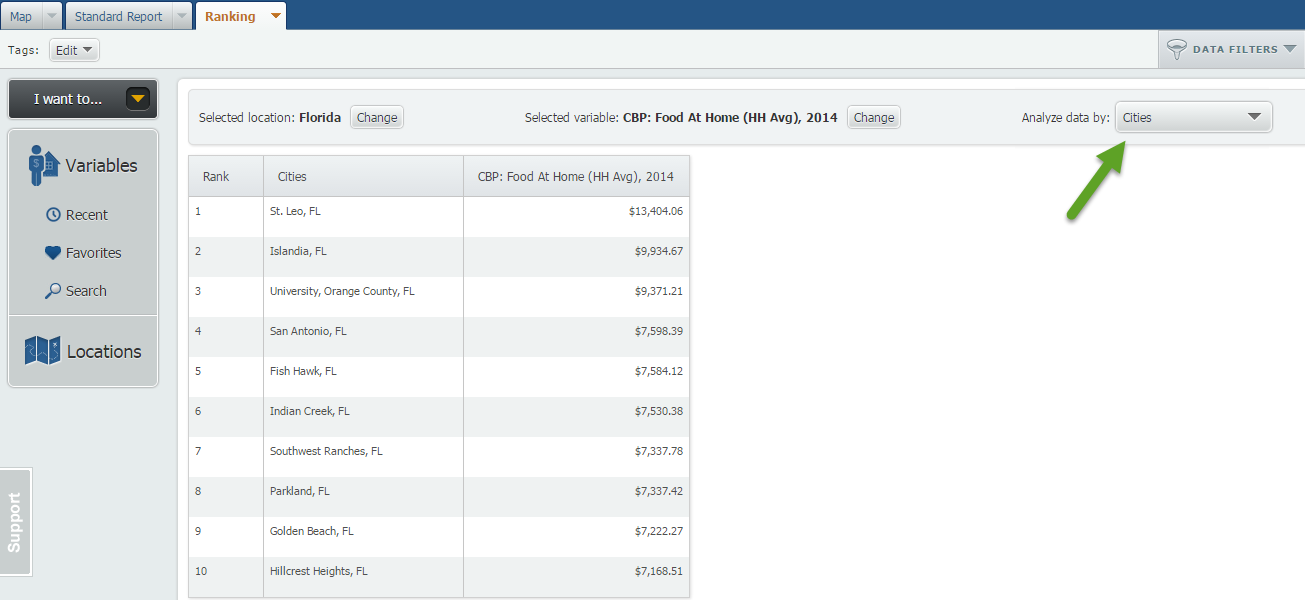
Next, use the Analyze Data By feature and select cities to reveal your target areas.
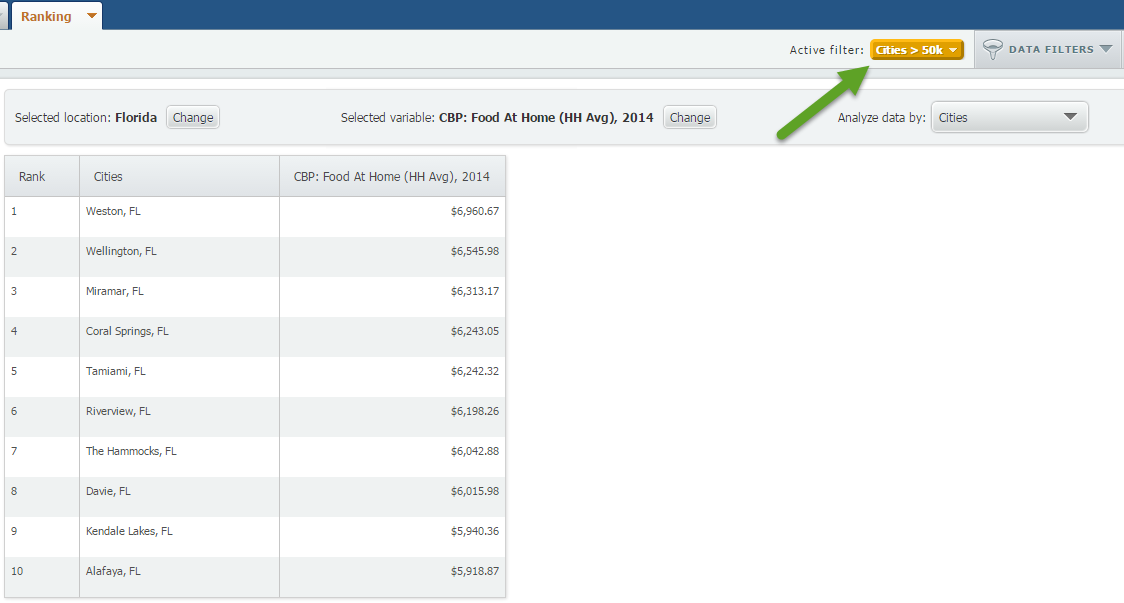
And that’s all there is to it! You might then be only interested in cities with a population of at least 50k. This can easily be done by applying a data filter (read more here). The new results are shown below:
Interested in specific maps or a particular dataset? Let us know!
More from SimplyAnalytics
Posted on Jun 09, 2016 by Admin
In this week’s blog, we’ll be featuring our newest data offering, PRIZM® Premier. If your institution currently subscribes to PRIZM data, this new module is available at no additional cos...
Posted on May 06, 2013 by Admin
The GRI team is looking forward to exhibiting at SLA 2013 at the San Diego Convention Center, June 9th through the 11th. The Special Libraries Association (SLA) is a nonprofit global orga...
Posted on Nov 06, 2019 by Admin
Hello readers! We hope you’re having a wonderful week. Today we feature another entry from our From the Help Desk series. Let’s get started! Question: How do I analyze data for downtown? ...
Posted on Jul 19, 2016 by Admin
Are you a tech wizard? Maybe you’re an apprentice? Learn more about technology consumption behaviors using the Simmons MOSAIC Technology Adoption segments located within the SimmonsLOCAL ...
Posted on Aug 22, 2009 by Admin
Lynda Kellam, the Data Services & Government Information Librarian at the University of North Carolina, Greensboro has produced some new tutorial videos to help students learn how to ...
Posted on May 25, 2010 by Admin
We will be exhibiting at the 2010 SLA Annual Conference & INFO-EXPO June 13-15 at the Ernest N. Morial Convention Center in New Orleans, LA. Join us at booth 1537 - bring your quest...
Posted on Jan 23, 2024 by Admin
We are excited to again make the trip to Los Angeles for SCELCapalooza 2024 hosted at Loyola Marymount University! Please drop by our table on Wednesday, Feb. 28th to learn more about Sim...
Posted on Feb 27, 2009 by Admin
Geographic Research, Inc. is pleased to participate in the Statewide California Electronic Library Consortium's (SCELC) 12th Annual Vendor Day. SCELC members and librarians from other aca...
Posted on Apr 18, 2017 by Admin
We look forward to attending the Texas Library Association Conference this week in San Antonio and visiting with the library community. Stop by our new SimplyAnalytics booth (2029) and ta...
Posted on Oct 24, 2014 by Admin
At times it can be useful to apply filters to the data in SimplyMap as a means of focusing on specific characteristics, or preforming a query. For example, a map showing household income ...