


Identifying Top PRIZM Segments
Posted on Feb 27, 2015 by Admin
SimplyMap is an excellent tool for market research, and it’s made even more powerful by Nielsen PRIZM data. Nielsen PRIZM is the highest quality market segment data available. Every household in the United States is assigned to one of 66 segments, and Nielsen provides detailed information about each segment, such as demographic characteristics, shopping habits, financial and technology preferences, media habits, and much more.
PRIZM segments define every U.S. household in terms of 66 demographically and behaviorally distinct types, or "segments," to help marketers discern those consumers’ likes, dislikes, lifestyles and purchase behaviors. Used by thousands of marketers within Fortune 500 companies, PRIZM provides the "common language" for marketing in an increasingly diverse and complex American marketplace.
Let’s start by identifying the largest PRIZM segments in some target locations.
First, create a Standard Report using your target locations. We’ll compare some different ZIP codes within and including the city of Boston, MA. Next, navigate to the PRIZM segments. You will want to select each # segment within that folder. Lastly, close the window to generate your report.
To locate the highest segment within each location, hover over a location and select Sort Descending. SimplyMap will reprocess the report, showing the highest figure at the top for the selected location.
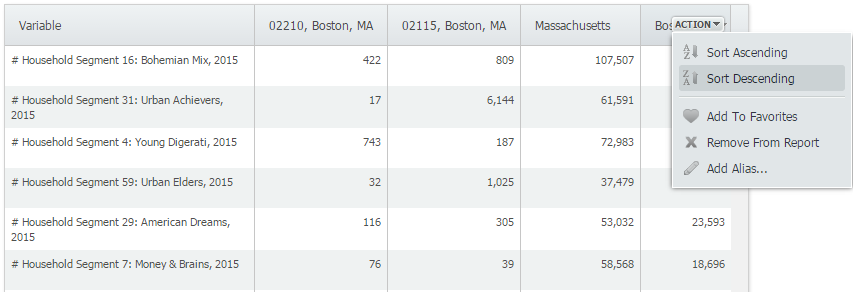 Here are the results for each ZIP code and the city of Boston.
02210: Young Digerati
02115: Urban Achievers
Boston: Bohemian Mix
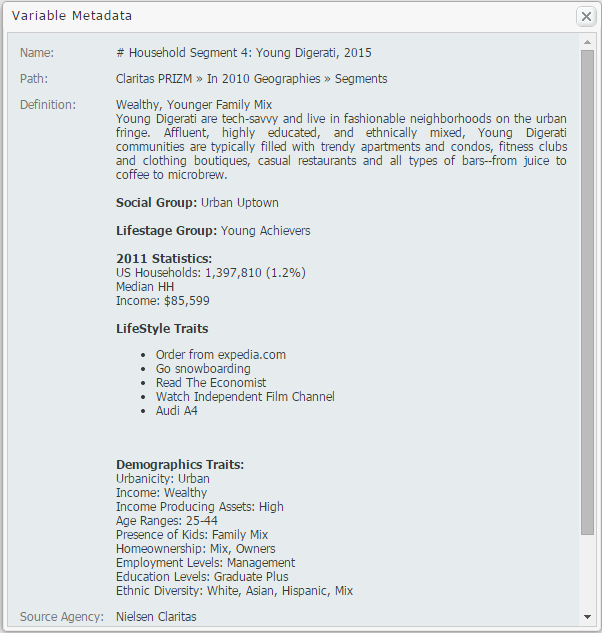
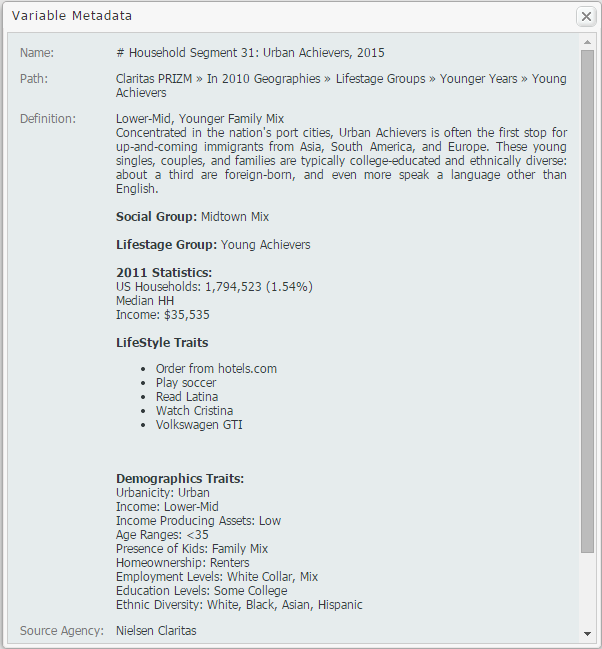
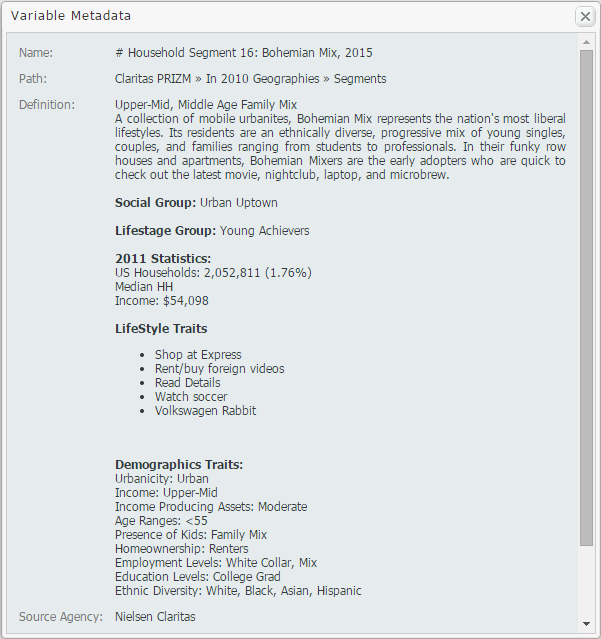
To find out more information about each segment, hover over the segment and select View Metadata. The metadata for each segment above is presented below:
ZIP Code 02210: Young Digerati
ZIP Code 02115: Urban Achievers
Boston, MA: Bohemian Mix Metadata
We hope you enjoyed this week’s blog. Stay tuned for more reports and SimplyMap tips! If you haven’t already, don’t forget to follow us on Twitter and Like Us on Facebook to get yourself entered into our Winter Sweepstakes!
More from SimplyAnalytics
Posted on Aug 22, 2009 by Admin
Lynda Kellam, the Data Services & Government Information Librarian at the University of North Carolina, Greensboro has produced some new tutorial videos to help students learn how to ...
Posted on Sep 05, 2019 by Admin
We are pleased to be exhibiting again at the Charleston Library Conference, on Tuesday November 5th, 2019. The Vendor Showcase will be held in the Gaillard Center Grand Ballroom (95 Calho...
Posted on Dec 15, 2014 by Admin
Stop by the Geographic Research booth at the Ontario Library Association Super Conference to check out SimplyMap Canada. The conference will take place January 28-31 at the Metro Toronto ...
Posted on Feb 05, 2015 by Admin
In this week’s edition of exploring SimplyMap data, we take a look at America’s coffee drinkers. SimplyMap contains more than 100 coffee related variables, including consumer spending on ...
Posted on Aug 26, 2015 by Admin
Most people in the United States could probably guess which cities are popular amongst tourists - Los Angeles and New York. But can you guess how much money is spent in novelty and souven...
Posted on Feb 14, 2017 by Admin
In previous blog entries, we highlighted the value of having a mapping application to complement premium data when analyzing America's geographic preferences in credit cards, and mayonnai...
Posted on Sep 10, 2010 by Admin
SimplyMap Canada is now available at several Canadian institutions, including York University and Ryerson University, in Toronto. SimplyMap Canada has all of the great features included i...
Posted on May 17, 2016 by Admin
This week’s SimplyMap report is a quick reader challenge. Can you guess what the map of the United States below is depicting? Keep in mind the legend colors - lighter is less, and darker ...
Posted on May 02, 2016 by Admin
Inspired by a recent support desk question, this week’s SimplyMap report will demonstrate how a user would run a business search that consists of multiple names. In short, the user was at...
Posted on Nov 24, 2014 by Admin
In this week’s report, we research America’s most educated cities. SimplyMap contains a total of 111 educational attainment variables, including general population and by race. We used th...