


Exploring SimplyMap Data: Internet Search Engines
Posted on May 26, 2016 by Admin
In this week’s report exploring SimplyMap data, we take a look at the variables available relative to internet search engines used. The source of this data will come from the SimmonsLOCAL data set which, as we’ve mentioned before, contains over 60,000 data variables. With that much data available, it’s safe to say that this series will be around for a very long time. Let’s get started!
Our general assumption here is that Google is the most used search engine in the United States. But does the data backup our assumption? Let’s find out.
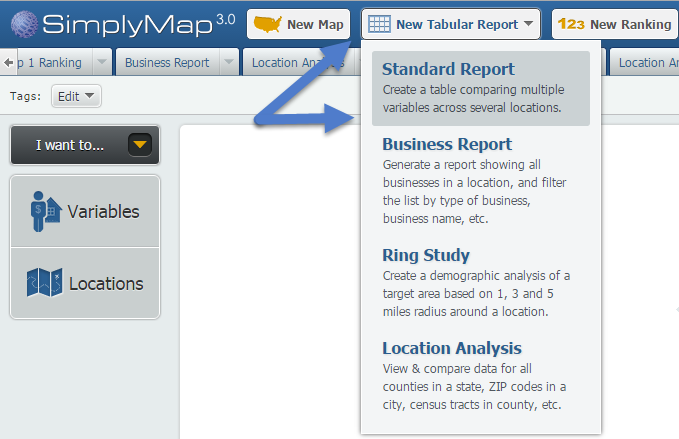
First, create a new Standard Report under the New Tabular Report button:
Next, open the Variables panel and navigate through the following path to find the variables of interest: SimmonsLOCAL » INTERNET » SEARCH ENGINES(COMPUTERS & OTHR DEVICES) » SEARCH ENGINES - HOW USED » SEARCH ENGINE I CURRENTLY USE MOST OFTEN.
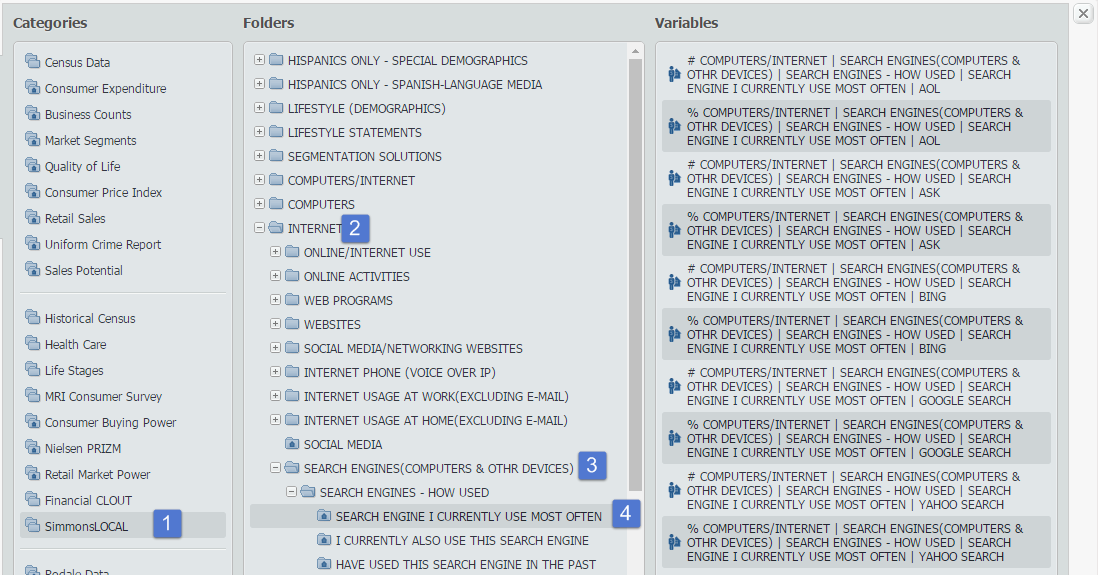
In total, there are four folders that contain search engine data, broken down by:
1. Search Engine I Currently Use Most Often
2. I Currently Also Use This Search Engine
3. Have Used This Search Engine in the Past
4. I Have Never Used this Search Engine
Each folder contains data on five search engines:
1. AOL
2. Ask
3. Bing
4. Google
5. Yahoo
As the path above indicates, we’ll be focusing on the first folder - Search Engine I Currently Use Most Often. Once you have selected the associated percent variables for the 5 search engines, close out your report to compile the data for the United States. Results below!
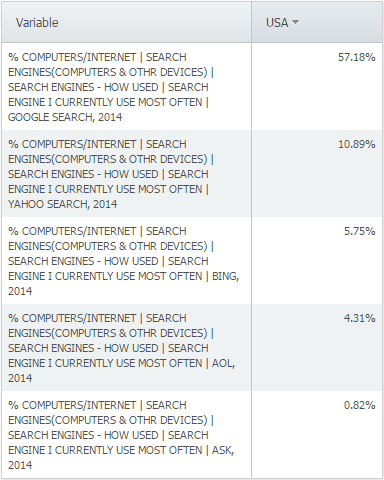
Our assumption was proven correct by the data, although the disparity between the search engines was surprising, with Google being the overwhelming favorite here in the United States.
Last week we posted a map challenging readers to guess what the map was portraying. The correct answer? Average Annual Snowfall (Total Inches)! If you guessed correctly, good job. If not, stay tuned for more!
More from SimplyAnalytics
Posted on Aug 27, 2018 by Admin
Welcome readers! This week we are excited to feature our newest view in SimplyAnalytics, the Time Series Table.What is it?The Time Series Table allows you to quickly pull all years availa...
Posted on Jul 28, 2013 by Admin
We recently discovered some interesting data on participation and attitudes towards recycling, and decided to dig a bit deeper into our Experian SimmonsLOCAL data. This data package inclu...
Posted on Mar 02, 2009 by Admin
ACRL's 14th National Conference will be held at the Washington State Trade and Convention Center in downtown Seattle, March 12-15, 2009. Every other year, ACRL offers its premier profe...
Posted on Dec 11, 2015 by Admin
With the final week of the college football season in the books, and bowl game selections having just taken place, we wanted to search within SimplyMap to see if any data pertaining to co...
Posted on Jan 24, 2009 by Admin
Men's Health magazine took a look this month at where our wireless habits are most out of control. Their methodology includes the use of SimplyMap: First, we crunched data from SimplyMap...
Posted on Feb 23, 2012 by Admin
Geographic Research, Inc. will be exhibiting at the Public Library Association (PLA) Conference. Visit us at Booth 2329 to learn more about SimplyMap and enter our raffle for a new com...
Posted on Dec 03, 2015 by Admin
With the Thanksgiving holiday last week, we decided to take a quick look into SimplyMap to see what pertinent variables are available for analysis. First, open the Variables panel and cli...
Posted on Mar 10, 2011 by Admin
The GRI team is looking forward to exhibiting at ACRL 2011 at the PA Convention Center in Philadelphia, March 30 - April 1, 2011. Every other year, ACRL offers its premier professional d...
Posted on Sep 14, 2021 by Admin
Welcome readers! Today we are excited to welcome histograms to SimplyAnalytics. We hope you enjoy this wonderful new visualization as much as we do. Let’s take a look. What is a histogram...
Posted on Jul 30, 2015 by Admin
One great feature within SimplyMap is the ability to track the same variable across multiple years. In this report, we will track the percentage of households in the US ordering items fro...