


SimplyMap Tip: Using a Radius Location
Posted on Mar 02, 2015 by Admin
In this week’s SimplyMap tip, we outline the process of creating a radius location. Radius locations are a great way to quickly gather information from an area surrounding a target address or neighborhood. In this example, we want to pull information from a 3 mile radius around a university campus.
First, open the locations panel in SimplyMap and Find location by: Block Groups. Next, Find the block group by address. When SimplyMap finds your location, select Create custom location and choose Radius.
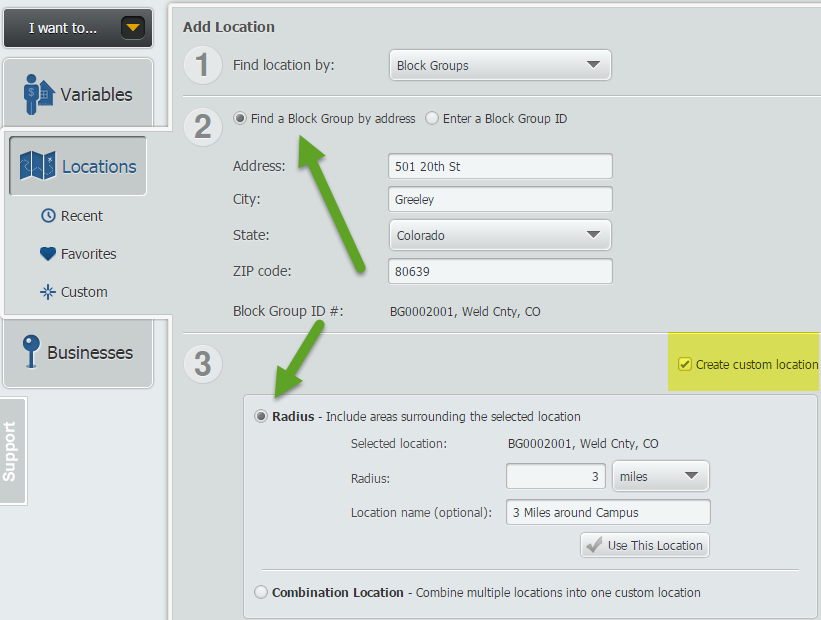
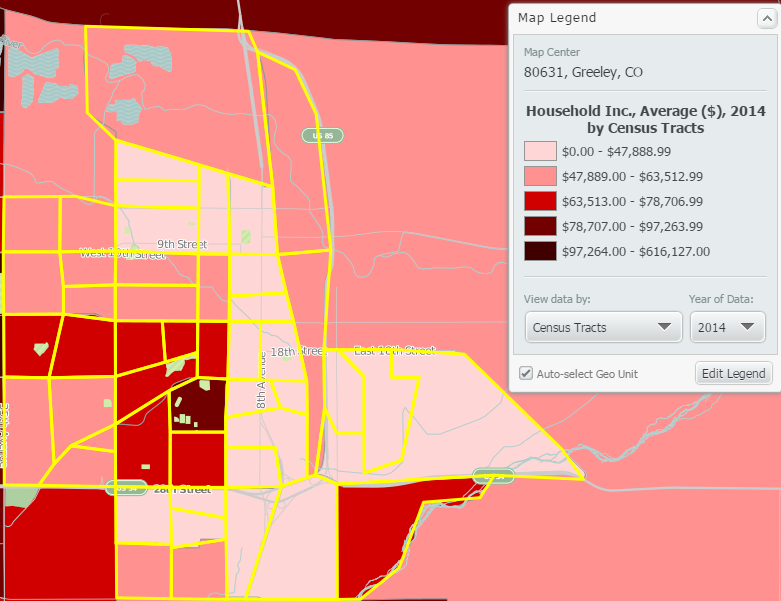
Enter your value in the available box, and give this location a name. Select Use This Location, and pick a variable of your choosing to quickly create a map. SimplyMap will generate a 3 mile radius around the address entered, as shown below.
Another great feature of radius locations is that they function as a custom location that can be used for reports. To quickly make a report, select Actions > Make Ranking from Map.
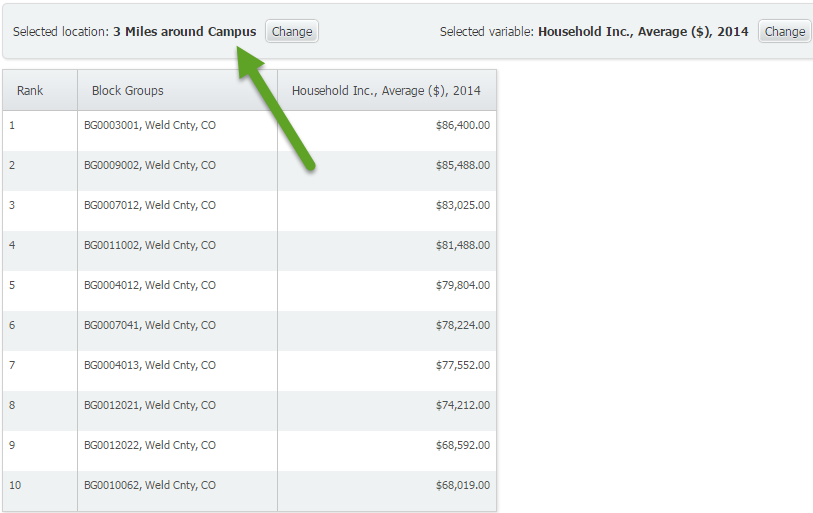
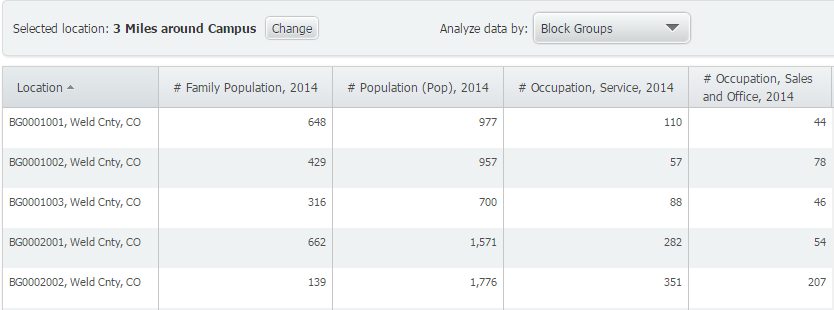
This will generate a ranking report of all the smaller geographies within the 3 mile radius from campus. Similarly, you can create a Standard Report or Location Analysis report using your new radius location.
Standard Report with Radius Location
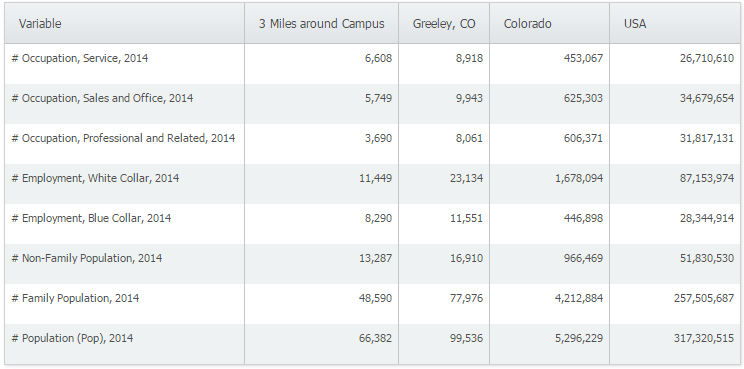
Location Analysis Report with Radius Location
We hope you found this week’s SimplyMap tip to be helpful. Stay tuned for more!
Have you already entered for your chance to win an iPad or Kindle Fire? We will be holding the drawing on April 17, 2015. To enter, simply follow us on Twitter and Like Us on Facebook to get your name in consideration.
More from SimplyAnalytics
Posted on Mar 04, 2014 by Admin
March 11-15 Indianapolis, Indiana The Public Library Association is prepared for another week of events, workshops and special appearances for librarians and authors. Visit our exh...
Posted on May 19, 2015 by Admin
We will be attending ALA this summer in San Francisco (hint: dress warm!). Visit us at Booth 413 and don't forget to enter our raffle - we will be giving away a $100 gift certificate to A...
Posted on Jan 18, 2008 by Admin
The BRASS Business Reference Sources Committee of Reference & User Services Quarterly (RUSA) selected SimplyMap as one of the Outstanding Business Reference Sources for 2007. Excerpt...
Posted on Apr 17, 2018 by Admin
The SimplyAnalytics team would like to congratulate Rachel Holder, MLS candidate at Indiana University for being selected as this year's recipient of the BRASS Student Travel Award! ...
Posted on Jan 16, 2026 by Admin
We are excited to be exhibiting at the Public Library Association (PLA) 2026 Conference in Minneapolis this April 1-3!
Posted on Nov 03, 2017 by Admin
This week we’ll talk about one of our favorite features in SimplyAnalytics - the custom combination location. This feature is a simple and effective means to create custom geographies whe...
Posted on Oct 26, 2018 by Admin
Welcome readers! This week we’ll take a look at how to browse for data by category in SimplyAnalytics. Browsing by Category is the default way of browsing for data in SimplyAnalytics. It ...
Posted on Jan 08, 2018 by Admin
The SimplyAnalytics team will be exhibiting at ALA Midwinter in Denver February 9-12. Stop by booth 2152 for a visit and a tour of SimplyAnalytics, the best-in-class analytics and data vi...
Posted on Feb 17, 2015 by Admin
Our recent trip to Chicago exhibiting at the ALA Midwinter Meeting inspired this week’s SimplyMap blog post. Today, we’re going to demonstrate how to use business points in SimplyMap to a...
Posted on May 28, 2009 by Admin
The Charleston Advisor, which publishes critical reviews of online resources for libraries, published a review of SimplyMap in April. We are very pleased to have received 4 1/4 stars out...