


From the Help Desk: How to Analyze all PRIZM Segments at Once
Posted on Dec 02, 2019 by Admin
Hi everybody! We’re back this week with another question from our Help Desk. This time featuring SimplyAnalytics Canada. Let’s get started!
Question: How can I analyze all of the PRIZM5 segments for my target area so I can identify the most common segment?
Note: For those unfamiliar with the PRIZM data, this dataset is a marketing segmentation system where households are grouped into one of 68 unique segments based on: demographics, lifestyles, consumer behaviour and settlement patterns in Canada. These segments help you understand what customers are buying, doing and thinking. This is ideal for target marketing, trade area analysis, merchandising and media planning.
Please give us an email if you would like a free trial to the PRIZM data - it is available for both SimplyAnalytics USA and SimplyAnalytics Canada.
Answer: The quickest and easiest way to analyze many similar variables at once is to utilize the Related Data Table. The Related Data Table automatically adds in any similar variables to your chosen one. In this example, we’ll add one PRIZM segment, and the report will add all of them in. This can be used with any variable or dataset - give it a try!
Here’s how:
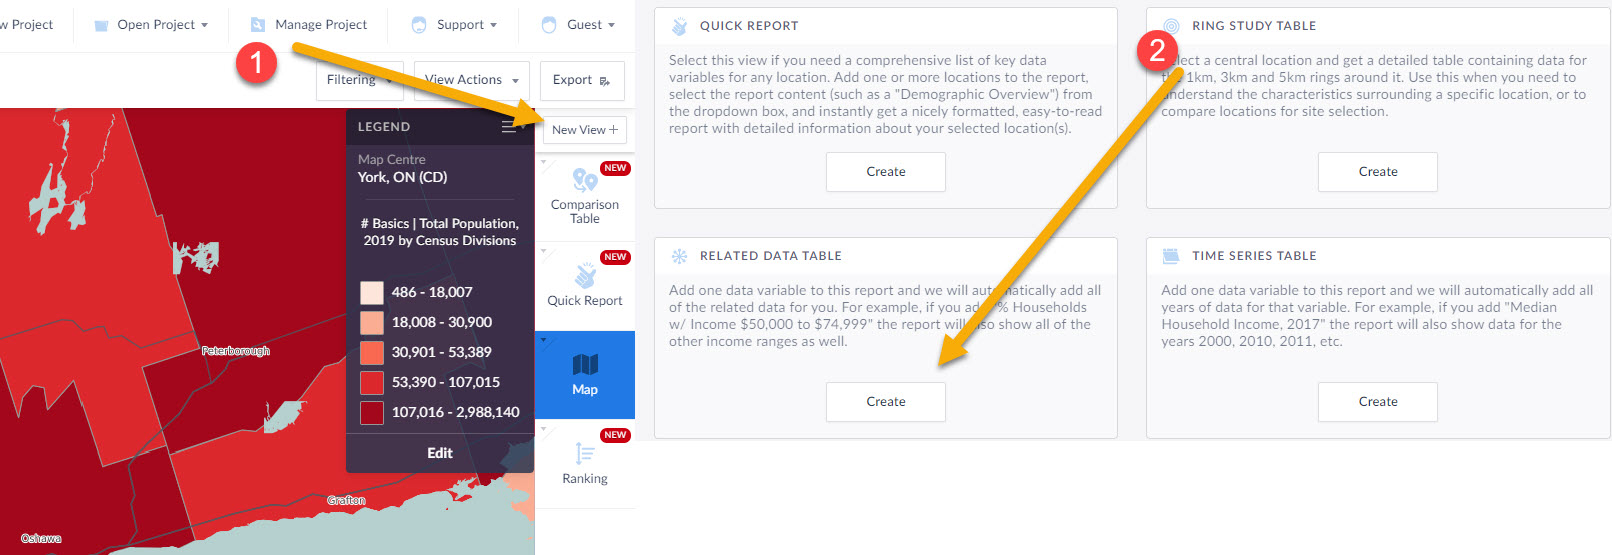
1.) Click on New View towards the top right, then create under Related Data Table
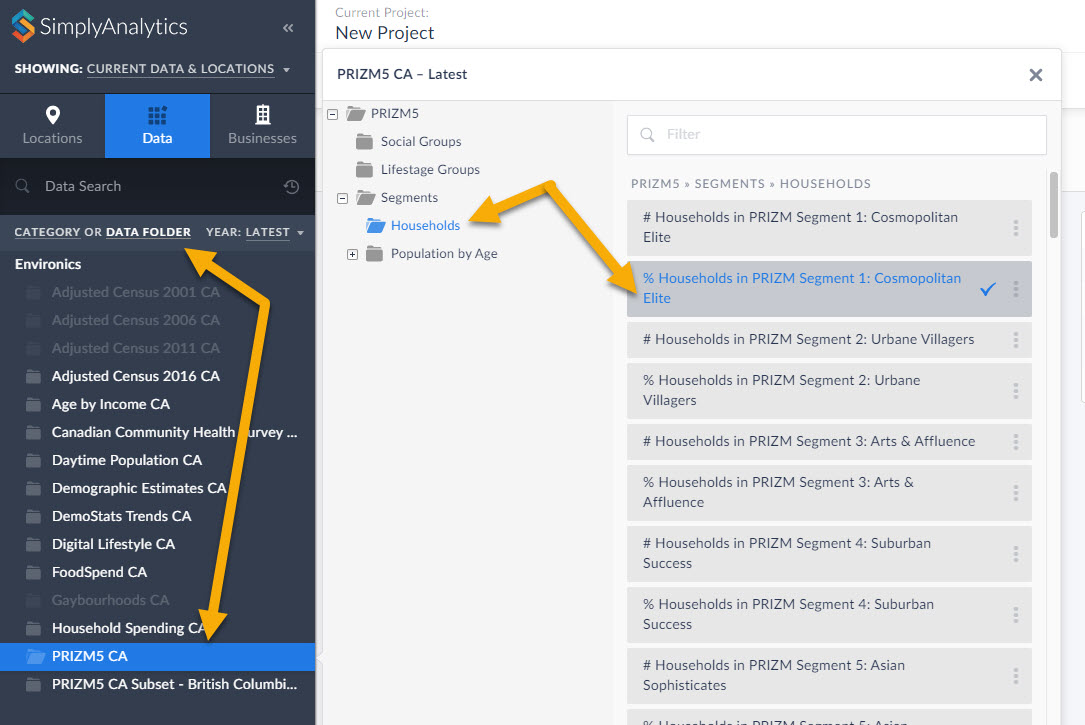
2.) Within the Data block, select any of the PRIZM segments, close the panel, and click on Done.
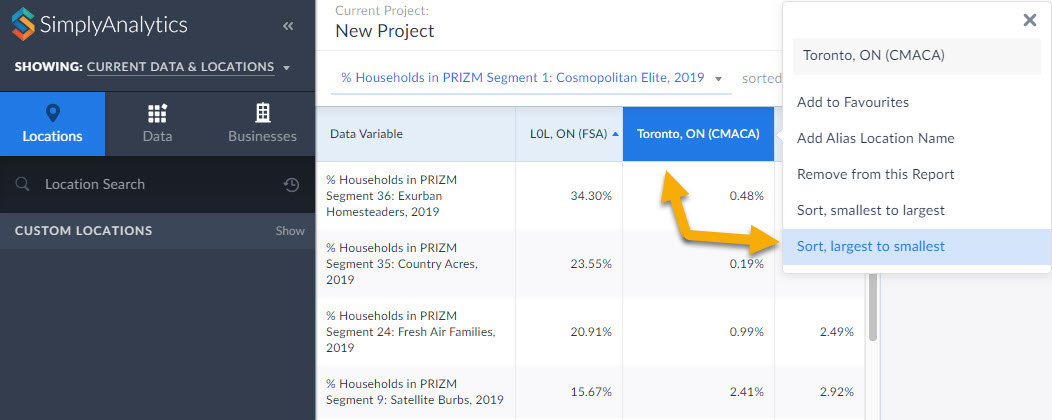
3.) The report will automatically add all PRIZM segments in the category you selected (households, in this case). Click on your location and Sort Descending to view the top segments in the given area. This is a powerful tool for users who want to market a product to a specific segment.
BONUS TIP: Within the Data Documentation page in the Support dropdown (top-right) users have access to the 2019 PRIZM Marketer's Handbook. Check out the super helpful Quick Reference PRIZM Guides on page 212 and 234. This is a great starting point for marketers to determine which PRIZM segments they want to focus on depending on age, children, urbancity, income, etc. For example, if you want high income suburban young families, you'd want Pets & PCs. You can favorite that PRIZM Segment, and use it in a Ranking Report to find out where all the Pets and PCs folks live in your requested geography.
That’s it for this week’s blog! Stay tuned for more.
More from SimplyAnalytics
Posted on Jun 02, 2017 by Admin
We can't wait for ALA Annual this Summer, and the opportunity to share SimplyAnalytics with the ALA community. Stop by the SimplyAnalytics booth (1339) and take a peak at what we've been ...
Posted on Sep 07, 2011 by Admin
Geographic Research will be exhibiting and presenting during a vendor showcase session at the upcoming North Carolina Library Association (NCLA) Biennial Conference, October 4-7, 2011 in ...
Posted on Mar 22, 2016 by Admin
Inspired by some recent support desk questions, this week’s SimplyMap report will provide some useful tips and tricks to help make the most out of your maps. Let’s get started! First, let...
Posted on Nov 03, 2017 by Admin
This week we’ll talk about one of our favorite features in SimplyAnalytics - the custom combination location. This feature is a simple and effective means to create custom geographies whe...
Posted on May 08, 2018 by Admin
This summer's ALA conference is in New Orleans and the SimplyAnalytics team will be exhibiting at booth #837. We hope you stop by to learn about new features, check out our new data offer...
Posted on Jan 23, 2024 by Admin
We are excited to again make the trip to Los Angeles for SCELCapalooza 2024 hosted at Loyola Marymount University! Please drop by our table on Wednesday, Feb. 28th to learn more about Sim...
Posted on Apr 17, 2009 by Admin
The Special Libraries Association will hold its Annual Conference in Washington, DC at the Washington Walter E. Washington Convention Center from June 14-17 2009. The conference will crea...
Posted on May 02, 2016 by Admin
Inspired by a recent support desk question, this week’s SimplyMap report will demonstrate how a user would run a business search that consists of multiple names. In short, the user was at...
Posted on Sep 15, 2025 by Admin
SimplyAnalytics will be attending the upcoming NCLA Conference in Winston-Salem October 14-17!
Posted on May 25, 2010 by Admin
We will be exhibiting at the 2010 SLA Annual Conference & INFO-EXPO June 13-15 at the Ernest N. Morial Convention Center in New Orleans, LA. Join us at booth 1537 - bring your quest...