


Exploring SimplyMap Data: P$YCLE
Posted on Apr 28, 2016 by Admin
In this week’s SimplyMap report we’ll take a look at one of our newer data packages offered, P$YCLE® by Nielsen.
P$YCLE® is a segmentation system that evaluates consumers using key demographic factors that have the greatest effect on their financial behaviors, such as income, age, presence of children, home ownership and Nielsen' proprietary measure of Income Producing Assets (IPA). The result is a total of 58 P$YCLE® segments, within 12 P$YCLE Lifestage Groups, each with distinct usage patterns for financial and investment products and services.
Let’s take a look at the top segments from a few cities around the US. First, create a new Standard Report (under New Tabular Report > Standard Report). Next, open the variables panel and navigate to the P$YCLE® segments folder - from there, select Add All Variables from the action dropdown that appears. Close out the panel to generate your report for the US.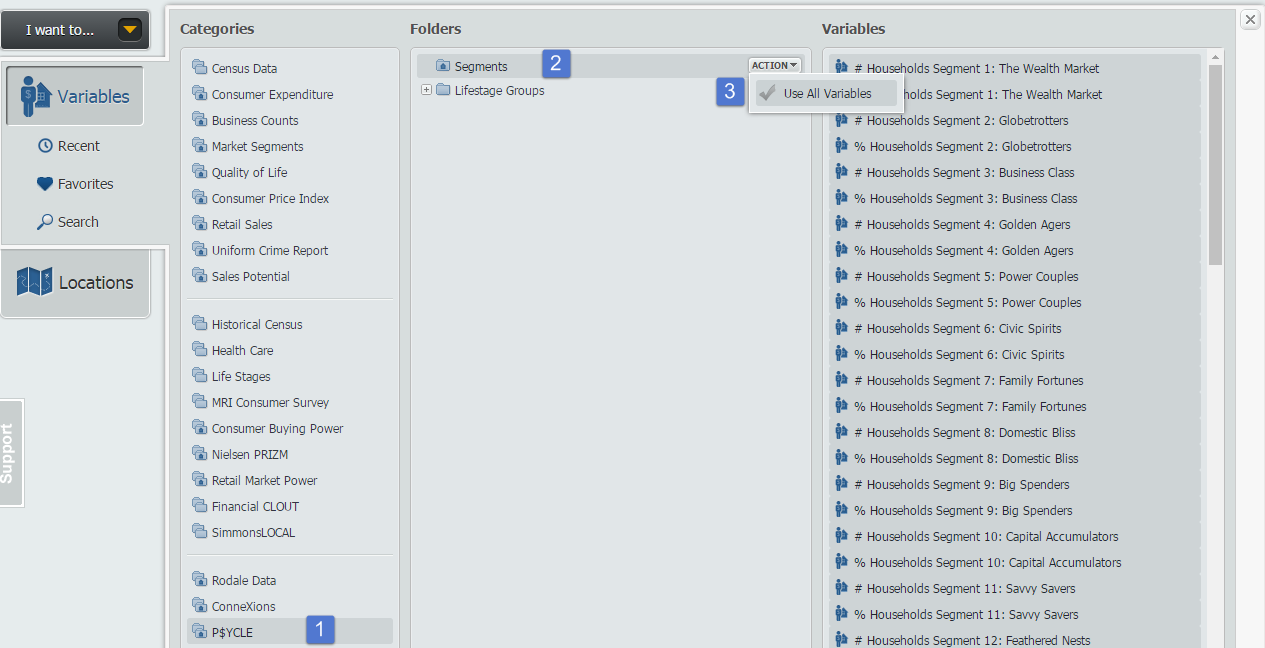
Hover over the Location header in your report and select Sort Descending to view the top segment for the United States:
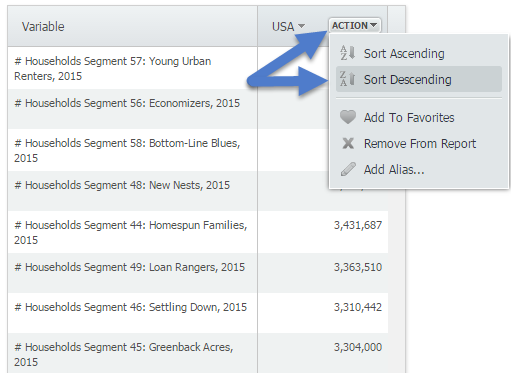
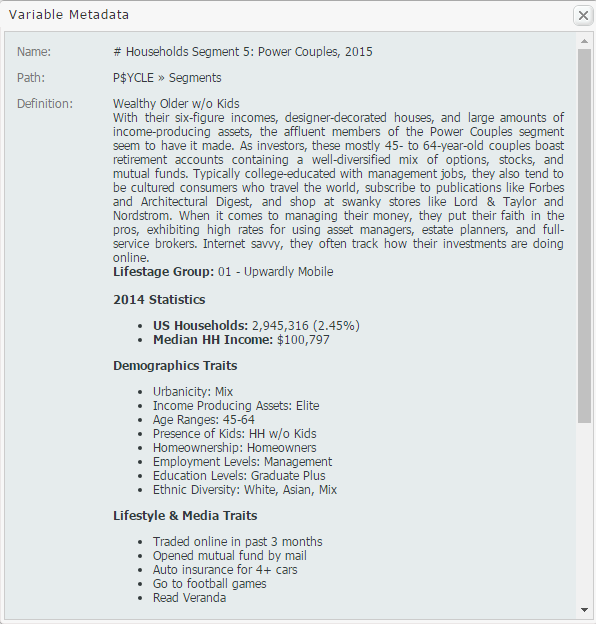
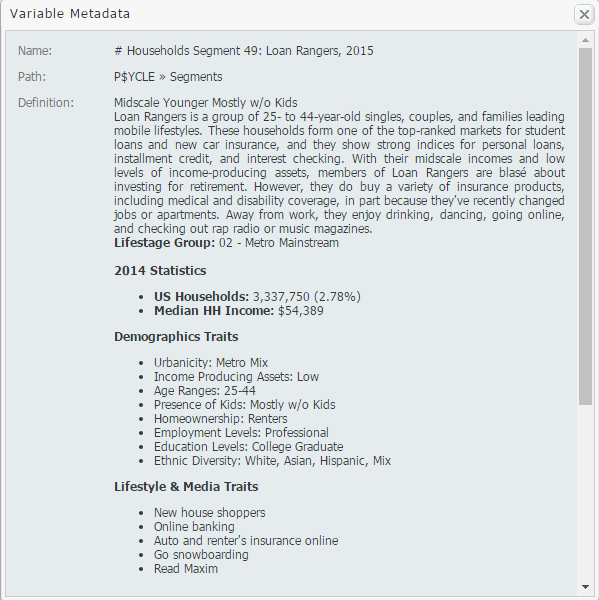
The top segment for the United States is Segment 57: Young Urban Renters. To read more about this segment, hover over the variable and select View Metadata.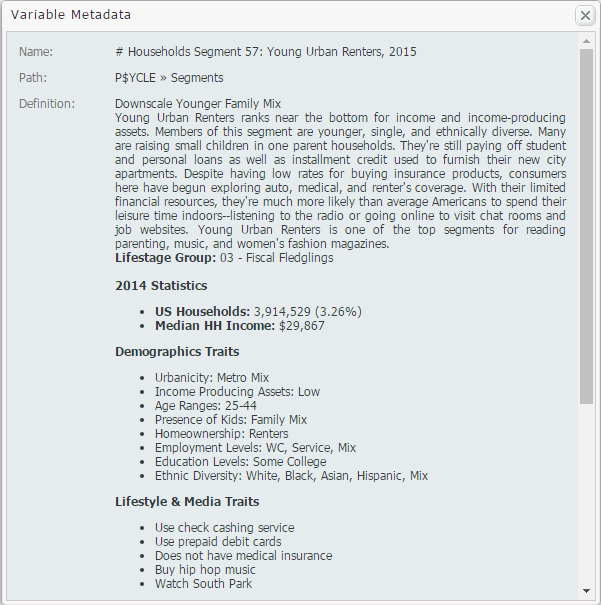
Lastly, add some locations of interest to your report and repeat the process above for each heading to view its highest segment. Results below!
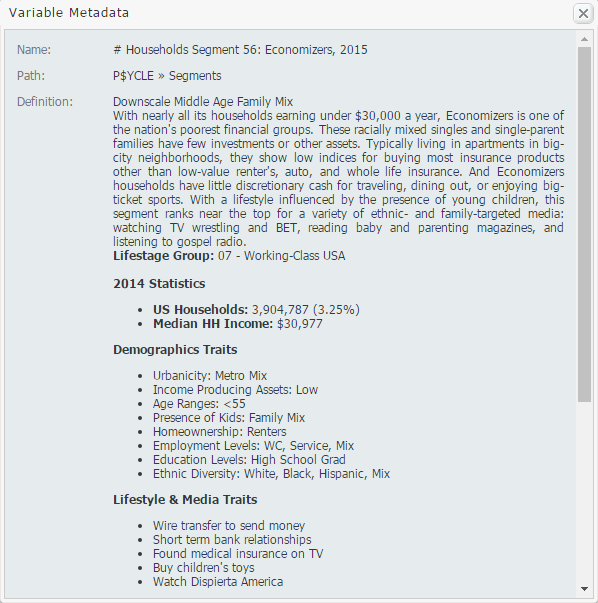
Houston, TX - Segment 56: Economizers
San Francisco, CA - Segment 5: Power Couples
Pittsburgh, PA - Segment 49: Loan Rangers
We hope you enjoyed this week’s SimplyMap report reviewing the P$YCLE® data set - if your institution is interested in a trial of this package, please email support@geographicresearch.com
More from SimplyAnalytics
Posted on Nov 22, 2016 by Admin
We will be exhibiting at ALA Midwinter in Atlanta, Georgia in January. You can find the GRI team at Booth 1155, where we will be catching up with customers old and new, and sharing some e...
Posted on Dec 11, 2023 by Admin
Hello readers! We have some fantastic news to share. SimplyAnalytics is thrilled to announce the addition of 2020 Election data to our expanding collection of powerful datasets. With this...
Posted on Sep 15, 2016 by Admin
While creating a radius location is the fastest and easiest method for creating a custom location, there may be situations that require a more specific and targeted locale. Let’s say for ...
Posted on Nov 24, 2014 by Admin
In this week’s report, we research America’s most educated cities. SimplyMap contains a total of 111 educational attainment variables, including general population and by race. We used th...
Posted on Jan 23, 2024 by Admin
We are excited to again make the trip to Los Angeles for SCELCapalooza 2024 hosted at Loyola Marymount University! Please drop by our table on Wednesday, Feb. 28th to learn more about Sim...
Posted on Feb 14, 2017 by Admin
In previous blog entries, we highlighted the value of having a mapping application to complement premium data when analyzing America's geographic preferences in credit cards, and mayonnai...
Posted on Jul 24, 2013 by Admin
Registration is now open for the North Carolina Library Association Conference! Visit us at the 60th biennial conference (Booth #45) through October 15 - 18, 2013. We have beautiful ca...
Posted on Sep 27, 2019 by Admin
Hello readers! This week we provide an in-depth response to a question asking about the legend classification methods in SimplyAnalytics. This response is now part of our Help Center: htt...
Posted on Nov 23, 2012 by Admin
Men's Health magazine is charting vanity in US cities, with help from SimplyMap. What did they find? The Sunshine State, with a long history of going to great lengths to look good, tops t...
Posted on May 19, 2016 by Admin
Drop by booth #215 at the SLA 2016 conference to chat with us and get the latest info on SimplyMap. We look forward to seeing our customers, friends, and all others interested in learning...