


Exploring SimplyMap Data: Using the Internet to Make Phone Calls
Posted on Sep 08, 2016 by Admin
One of our favorite uses of SimplyMap is to find data that validates our general assumptions and observations. For example, in a previous blog we wrote about the growth of tablet ownership in the US and how the iPad dominates that area. It’s one thing to “know” that tablet ownership has grown, but it’s another thing to view the supporting data behind it.
This week, let’s explore another variable we presume has markedly increased in recent years - the % of Households who used the internet to make a phone call. Let’s get started!
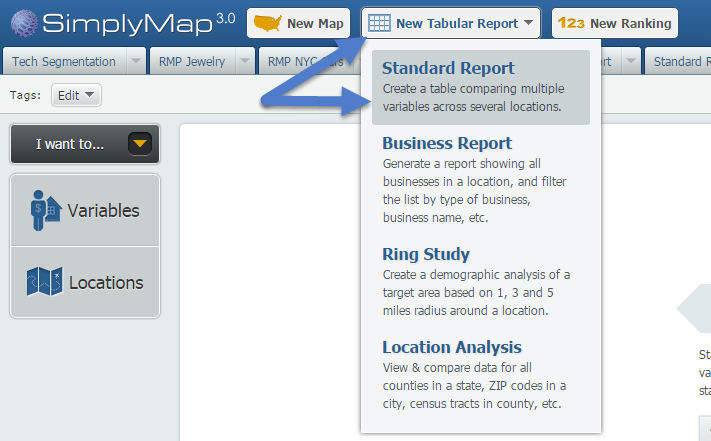
Open up a Standard Report via the New Tabular Report button at the top of SimplyMap:
Navigate through this path: MRI Consumer Survey » Internet » Internet Access and Activities to find the variable, % Households Using - Internet Activities: Made a phone call, 2015.
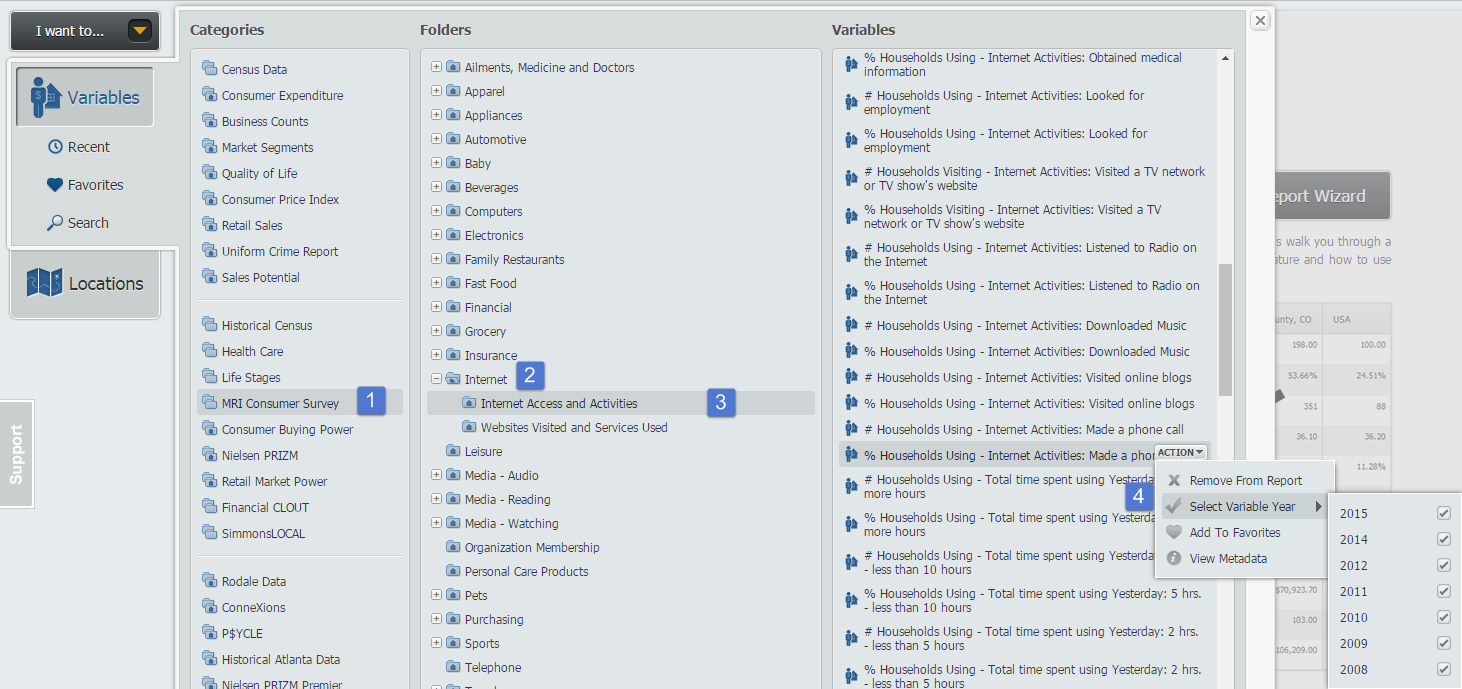
Hover over the Action menu on the variable and select the available years from the Select Variable Year option, shown above.
Close out the Variables panel to generate your report. Results below!
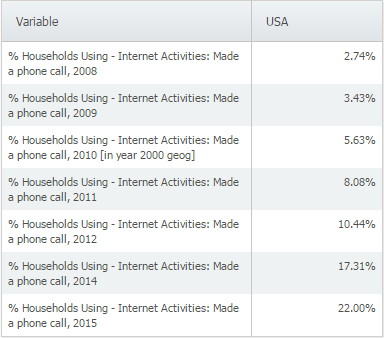
It looks like using the internet to make a phone call has exploded in recent years, from 2.7% in 2008 to 22% in 2015. Why do you think this is? Aside from the availability of the internet in general, it could be due to the rise in tablets, FaceTime and Skype.
Stay tuned for more in this series, and let us know if there’s anything within SimplyMap you’d like to see written about!
More from SimplyAnalytics
Posted on Mar 18, 2015 by Admin
Can you guess which US city has the most residents per square mile? Today we’re going to use SimplyMap to answer this question for all cities, as well as cities with a population greater ...
Posted on May 28, 2009 by Admin
The Charleston Advisor, which publishes critical reviews of online resources for libraries, published a review of SimplyMap in April. We are very pleased to have received 4 1/4 stars out...
Posted on Nov 06, 2019 by Admin
Hello readers! We hope you’re having a wonderful week. Today we feature another entry from our From the Help Desk series. Let’s get started! Question: How do I analyze data for downtown? ...
Posted on Feb 02, 2024 by Admin
We are excited to be back exhibiting at PLA this April in Columbus, OH. Join us at Booth #2631 to discover how SimplyAnalytics can help libraries understand their service area, assist sma...
Posted on Aug 20, 2015 by Admin
Is there a specific age group and income bracket you are specifically interested in researching for a target location? Our Life Stages module has the information you need. Life Stages, by...
Posted on May 19, 2015 by Admin
We will be attending ALA this summer in San Francisco (hint: dress warm!). Visit us at Booth 413 and don't forget to enter our raffle - we will be giving away a $100 gift certificate to A...
Posted on Sep 08, 2016 by Admin
One of our favorite uses of SimplyMap is to find data that validates our general assumptions and observations. For example, in a previous blog we wrote about the growth of tablet ownershi...
Posted on Nov 23, 2012 by Admin
Men's Health magazine is charting vanity in US cities, with help from SimplyMap. What did they find? The Sunshine State, with a long history of going to great lengths to look good, tops t...
Posted on Dec 11, 2023 by Admin
Hello readers! We have some fantastic news to share. SimplyAnalytics is thrilled to announce the addition of 2020 Election data to our expanding collection of powerful datasets. With this...
Posted on Sep 27, 2019 by Admin
Hello readers! This week we provide an in-depth response to a question asking about the legend classification methods in SimplyAnalytics. This response is now part of our Help Center: htt...