


Introducing Election Data
Posted on Dec 11, 2023 by Admin
Hello readers! We have some fantastic news to share. SimplyAnalytics is thrilled to announce the addition of 2020 Election data to our expanding collection of powerful datasets. With this latest update, you can now gain deeper insights into the electoral landscape of the United States, and best of all - this dataset is free and available now for all SimplyAnalytics customers! Let's delve into the significance of this update.
 Explore the 2020 Election Data:
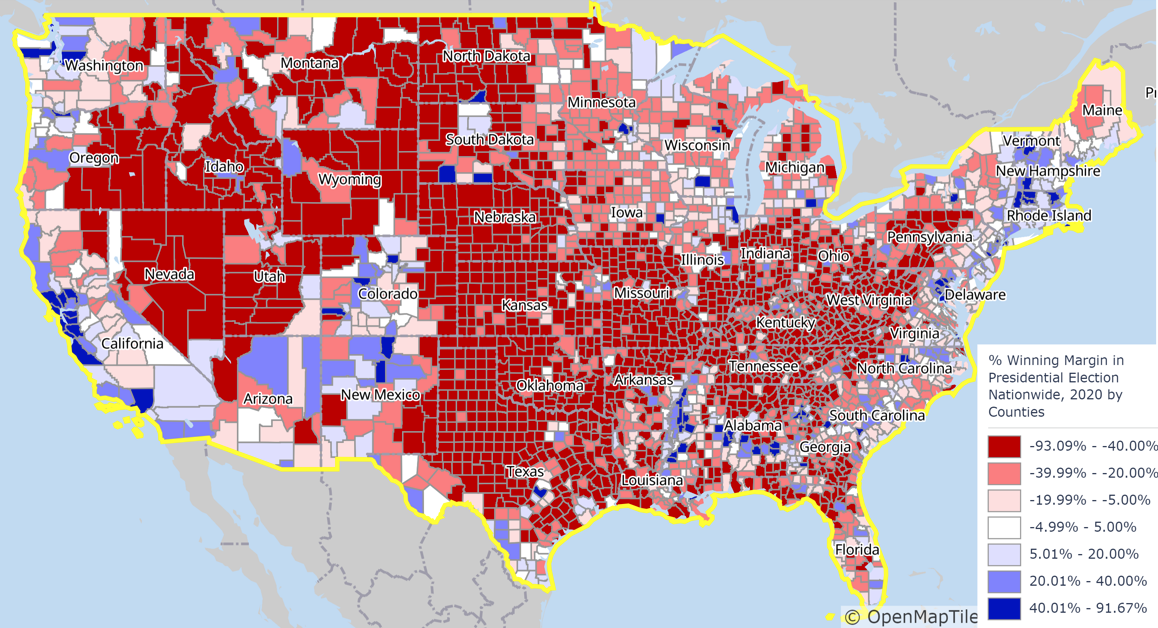
With the inclusion of 2020 Election data in SimplyAnalytics, you can access a comprehensive range of election information. Dive into county-level voting results for:
- Presidential (Winning margin, Democrat votes, Republican votes)
- US Senate (Winning margin, Democrat votes, Republican votes)
- US House (Winning margin, Democrat votes, Republican votes)
- Governor (Winning margin, Democrat votes, Republican votes)
You will also have the opportunity to analyze specific candidates in state-wide elections. For example, votes for Jon Ossoff versus David Perdue for the counties in Georgia or John Rutherford versus Donna Deegan in Florida’s 4th Congressional District.
Gain Actionable Insights & Commingle Data for a Holistic Picture:By analyzing 2020 Election data in SimplyAnalytics, you can identify voting patterns, assess the influence of different demographics, and uncover trends that shaped the final outcome.
With our intuitive mapping and visualization tools, you can also easily transform this raw 2020 Election data into visually engaging and easy-to-understand maps, charts, and graphs.
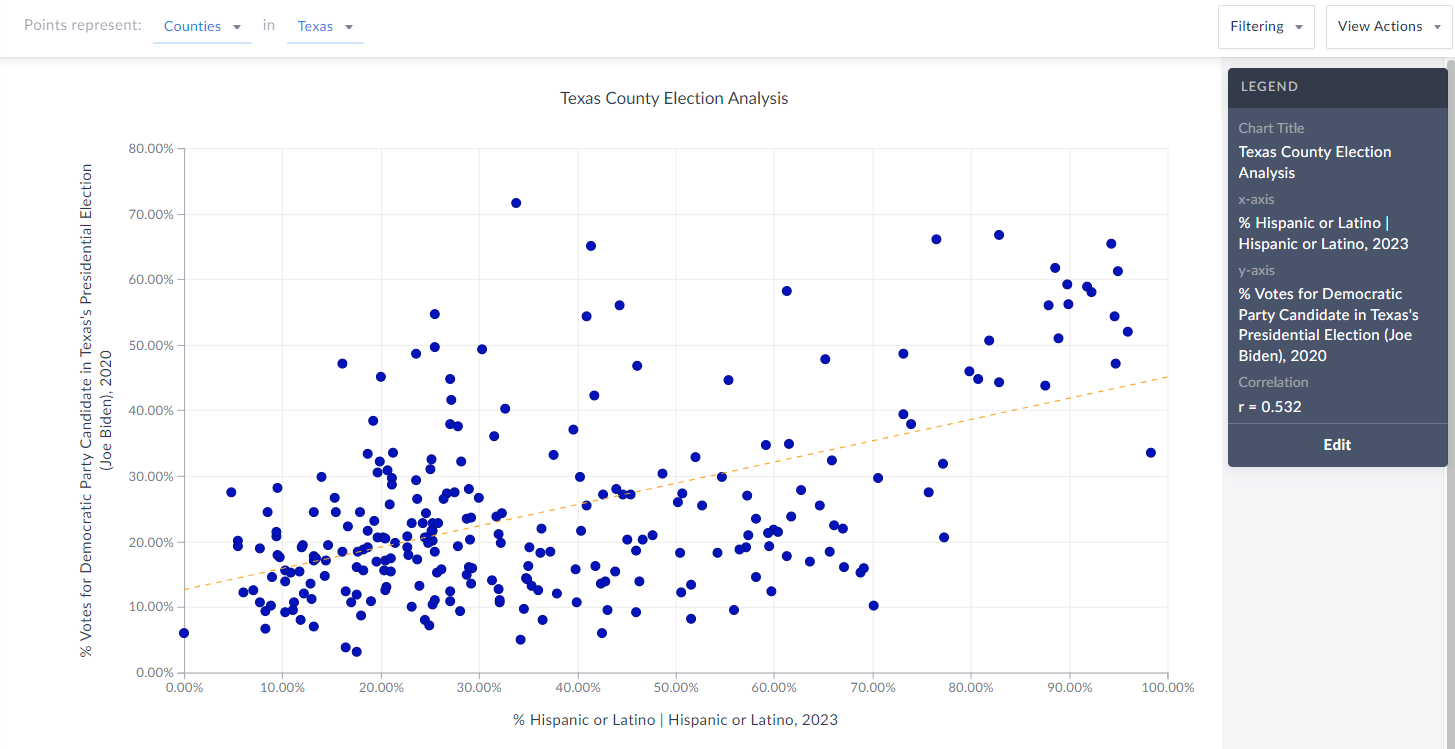
Of course, SimplyAnalytics also has the ability to combine datasets seamlessly. By co-mingling 2020 Election data with other demographic, marketing, psychographic or even health datasets, you can create a holistic picture of the election's results. For example, you can explore correlations between voting patterns and income levels or lifestyle data.
The addition of 2020 Election data to SimplyAnalytics is an exciting milestone, opening up new possibilities for exploration and analysis. Whether you are a researcher, student, business professional, or a data enthusiast, this update is sure to provide a valuable resource for better understanding the 2020 U.S. Presidential Election.
Log in to SimplyAnalytics now and start exploring. Have fun!
More from SimplyAnalytics
Posted on Nov 03, 2017 by Admin
This week we’ll talk about one of our favorite features in SimplyAnalytics - the custom combination location. This feature is a simple and effective means to create custom geographies whe...
Posted on Aug 02, 2016 by Admin
Did you know that you can use SimplyMap to identify which make and model of vehicle is most prevalent within any location in the United States? In this week’s SimplyMap report, we’ll take...
Posted on Oct 23, 2009 by Admin
SimplyMap was highlighted in the Wake County, NC Public Library Business Blog today as a valuable tool for business planning. Wake County has access to SimplyMap through NC LIVE, a statew...
Posted on Jan 18, 2009 by Admin
Michigan State University is offering their users a basic introduction to using SimplyMap. The 1.5 hour session will cover the basics of how to use SimplyMap to create maps and reports u...
Posted on Oct 29, 2015 by Admin
Did you know that SimplyMap allows you to search for businesses by NAICS or SIC codes? Searching by these codes is a great alternative to the general keyword search. Using the keyword sea...
Posted on Jul 22, 2015 by Admin
In this week’s SimplyMap report, we take a look at one of our newly available data packages - ConneXions® from Nielsen. The ConneXions® segmentation system integrates consumer behavior an...
Posted on May 26, 2016 by Admin
In this week’s report exploring SimplyMap data, we take a look at the variables available relative to internet search engines used. The source of this data will come from the SimmonsLOCAL...
Posted on Jan 28, 2010 by Admin
Come visit the Geographic Research booth at the Ontario Library Association Super Conference, February 24-27, 2010 at the Metro Toronto Convention Centre. The Ontario Library Association ...
Posted on Feb 01, 2009 by Admin
Want to know the top 10 wealthiest ZIP codes in your state? How about the top 25 counties with the most elderly residents? Duke University students can now easily answer these questions a...
Posted on Feb 24, 2023 by Admin
We are excited to attend SCELCapalooza 2023, a three-day conference for academic and research librarians in Southern California. The Vendor Day showcase will take place on March 1st, 2023...