


Feature Spotlight: Custom Combination Location
Posted on Nov 03, 2017 by Admin
This week we’ll talk about one of our favorite features in SimplyAnalytics - the custom combination location. This feature is a simple and effective means to create custom geographies where you’re able to specify the exact makeup for. Let’s jump in.
Why would I want to use this feature?
Sometimes you may want to study a neighborhood in your city, or area that you know of that isn’t necessarily a formal geography itself. One of the common questions we get asked is, “How do I get data for “my neighborhood” or “downtown”?” and that’s a fair question - the problem is, “my neighborhood” or “downtown” is not a formal Census geography, but it’s probably a combination of a few CTs or ZIP Codes. That’s where the Custom Combination Location feature comes into play.
How to Use It:
In this example, we’re going to make the Greenwich Village and Soho neighborhoods in Manhattan.
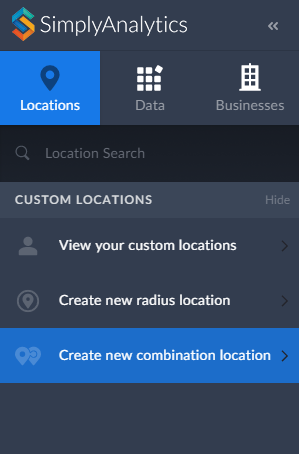
1. Click on Create New Combination Location found within the Locations tab towards the left of the screen.
2. Give your location a name.
3. Enter in the locations that comprise your target area - in this case, the Greenwich Village and Soho neighborhoods consist of ZIP Codes: 10012, 10013 and 10014.
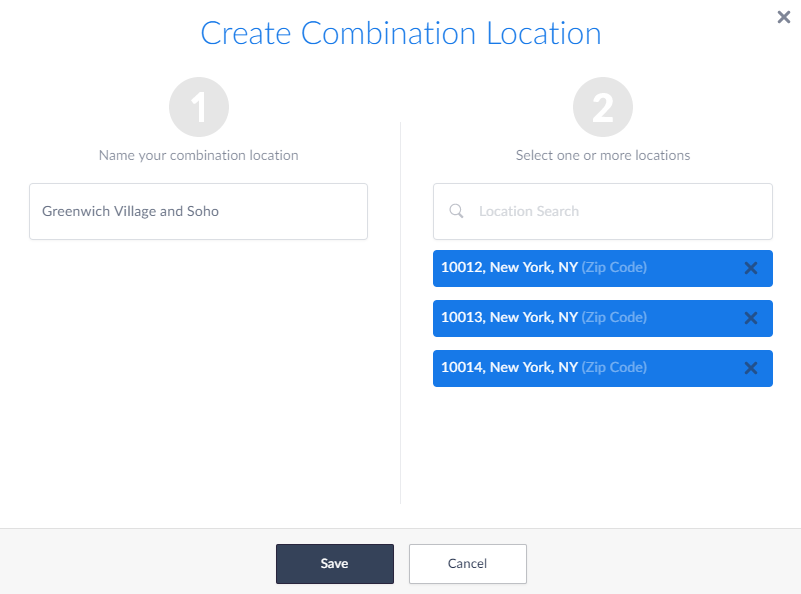
4. Select Save
Use your Location:
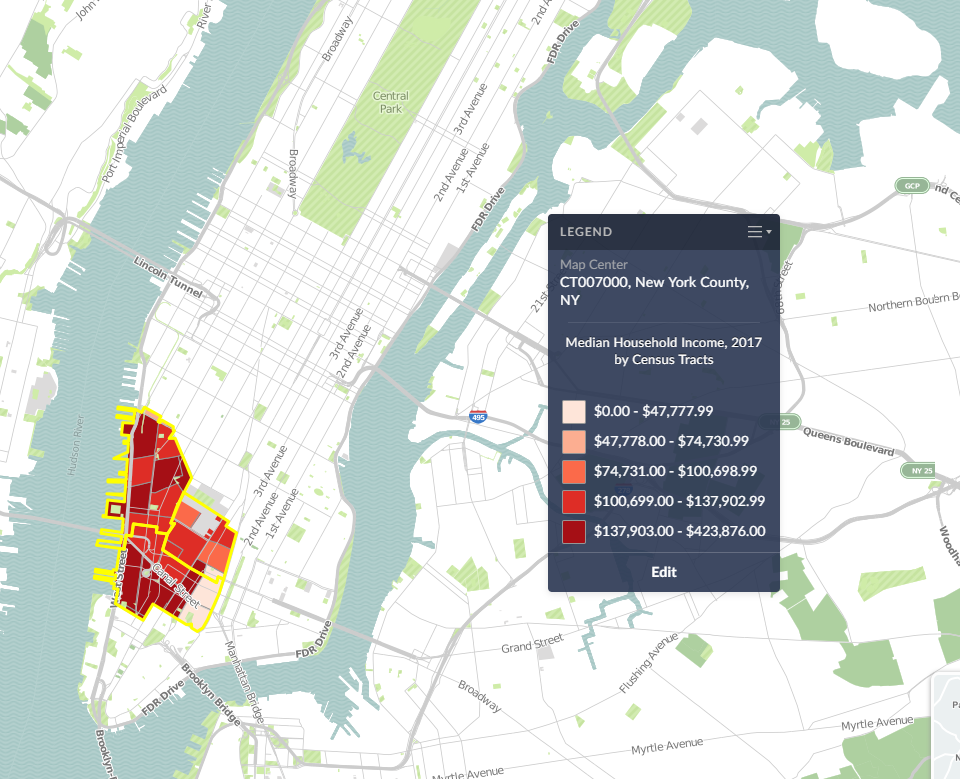
Now that your custom location is saved, you are free to use it in Maps and reports. Your custom location will be stored within the View your Custom Locations option in the Locations tab.
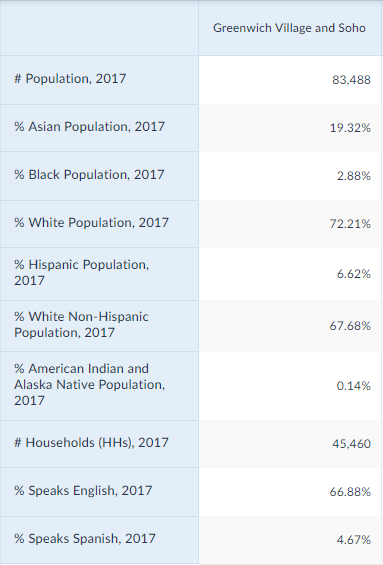
SimplyAnalytics will calculate the #, % and Average variables for you in reports:
And that’s it for today! In a future post, we’ll talk about creating combination locations from your recently used and favorite locations.
More from SimplyAnalytics
Posted on Dec 08, 2017 by Admin
Good afternoon, readers! This week we’re going to talk about project management in SimplyAnalytics and how to best take advantage of it. Why are projects needed? Many users have multiple...
Posted on Apr 14, 2016 by Admin
This week’s SimplyMap report will provide an overview of one of the more advanced functionalities in SimplyMap - applying multiple filter conditions. Filters can be applied to any map or ...
Posted on Aug 20, 2015 by Admin
Is there a specific age group and income bracket you are specifically interested in researching for a target location? Our Life Stages module has the information you need. Life Stages, by...
Posted on Feb 21, 2018 by Admin
We are looking forward to attending our first Electronic Resources & Libraries (ER&L) conference in Austin, TX! Visit us at Table #510 for a closer look at SimplyAnalytics – the b...
Posted on Dec 09, 2014 by Admin
In this week’s SimplyMap blog post, we set out to discover which large US cities spend the most money per year on their pets. To find this out we used the variable, “Pets, Household Avera...
Posted on Aug 27, 2018 by Admin
Welcome readers! This week we are excited to feature our newest view in SimplyAnalytics, the Time Series Table.What is it?The Time Series Table allows you to quickly pull all years availa...
Posted on Sep 10, 2019 by Admin
Hello readers! It’s been a minute since our last tutorial post, but you can expect to see more content on a weekly basis moving forward. “From the Help Desk” is a new feature on the blog ...
Posted on Feb 05, 2015 by Admin
In this week’s edition of exploring SimplyMap data, we take a look at America’s coffee drinkers. SimplyMap contains more than 100 coffee related variables, including consumer spending on ...
Posted on Dec 07, 2011 by Admin
We will be exhibiting at the American Library Association Midwinter Meeting & Exhibition in Dallas this January. Visit us at booth 2513 for a demonstration and to have all your Simply...
Posted on Aug 13, 2015 by Admin
In this quick SimplyMap report, we use Census data to help us identify which city in the United States has the highest percentage of residents who reported walking to work as their mode o...