


Release Announcement
Posted on Nov 28, 2023 by Admin
Hello readers! We are happy to announce that SimplyAnalytics has successfully migrated to the Census 2020 boundaries on Sunday, November 19th. This blog will talk about what that is, what it means for you now, and what it means moving forward. Let’s get into it.
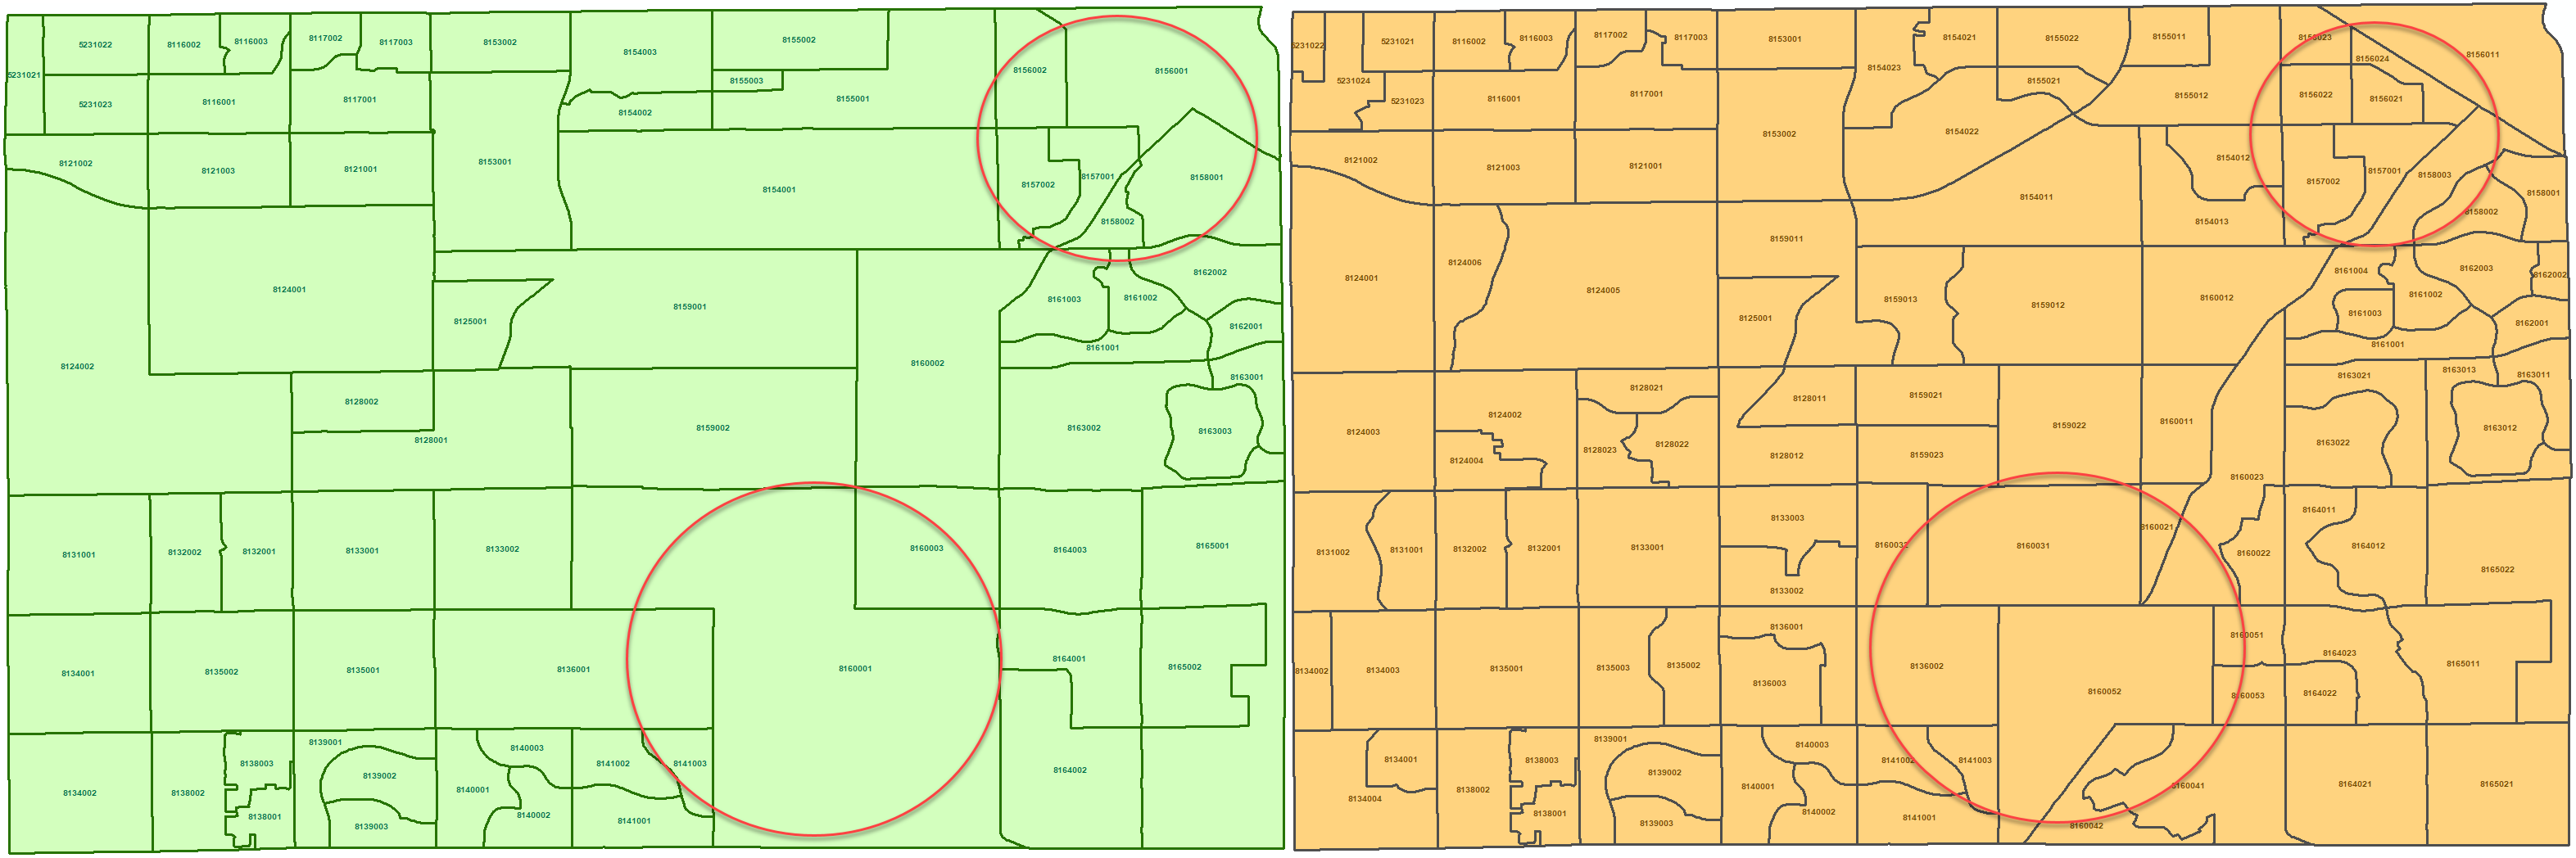
What is this migration all about?The United States Census Bureau provides updates to location boundaries every 10 years. They do this based on population changes and to ensure fair representation for locations that have changed over time. For example, maybe a Census Tract or Census Block Group has grown in population over time, and once it reaches a certain population threshold, that Census Tract or Block Group will get split up, and new Tracts or Block Groups will be created.
Check out the example below that highlights the same area in Arizona in 2019 (green), and then with updated boundaries in 2020 (orange).
If you’re interested in a more detailed overview of this, feel free to check out the video here: https://vimeo.com/user68002385/simplyanalytics-historical-mode?share=copy
What does it mean for SimplyAnalytics?By default, SimplyAnalytics is now in 2020 boundaries, and with that comes a host of newer data, including 2023 Community Demographics, the complete 2021 ACS (with 2022/23 estimates), The 2020 Decennial Census, and a new 2020 Election dataset - more on that in a future blog.
For returning users: If you are a returning user, you might notice that your views have a historical badge on them or that there’s a note at the top, and it’ll look like this:
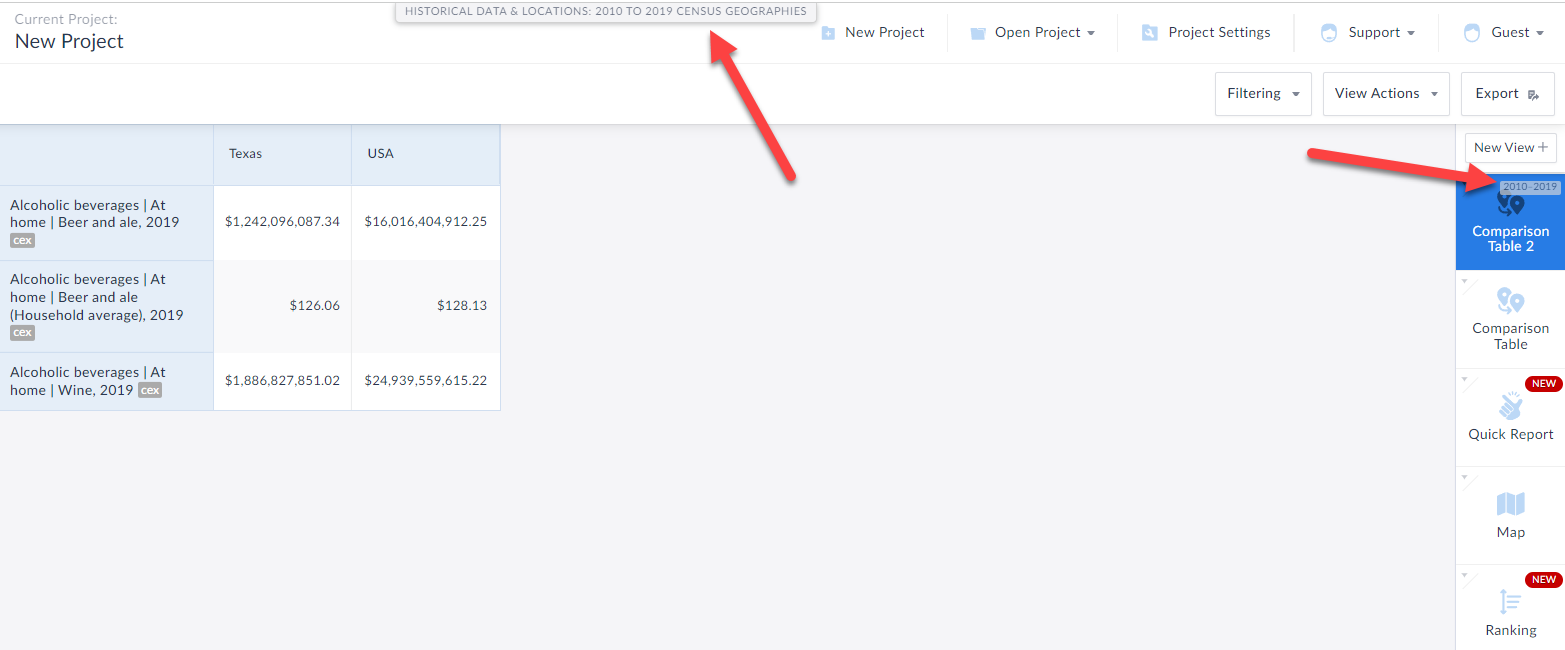
This is because all of your work prior to Nov. 19th, 2023, would have been in the older geographies, but as mentioned above SimplyAnalytics now defaults to 2020 Census boundaries.
What if I want to explore the newest data? If you want to use the newest data, simply click on New View at the top-right of the screen and proceed as you normally would. However, if you want to continue using the now older data, you’ll have to go into historical mode - similarly, some datasets are not yet migrated to the new boundaries, and so if you want to access those, you’ll need to use historical mode.
Final NotesFor existing/returning users, we understand that there might be some confusion with accessing some datasets that are not yet available in the newer geographies. But please note that this is temporary. As all future years of the datasets you’ve come to love come online, the only reason you’ll need to go into Historical Mode will be if you want older years of data which is how it has traditionally been.
As always, we are here to help! Please email support@simplyanalytics.com if you are running into any issues.
More from SimplyAnalytics
Posted on Jul 30, 2015 by Admin
One great feature within SimplyMap is the ability to track the same variable across multiple years. In this report, we will track the percentage of households in the US ordering items fro...
Posted on Mar 13, 2023 by Admin
Hello readers! Today, we’re excited to officially introduce the Location Query Report in SimplyAnalytics. The Location Query Report is a powerful feature in SimplyAnalytics that allows us...
Posted on May 06, 2013 by Admin
The GRI team is looking forward to exhibiting at SLA 2013 at the San Diego Convention Center, June 9th through the 11th. The Special Libraries Association (SLA) is a nonprofit global orga...
Posted on Jun 02, 2017 by Admin
We can't wait for ALA Annual this Summer, and the opportunity to share SimplyAnalytics with the ALA community. Stop by the SimplyAnalytics booth (1339) and take a peak at what we've been ...
Posted on Jan 10, 2024 by Admin
We are delighted to announce our sponsorship of the Midwest Entrepreneurship Case Competition! At SimplyAnalytics, we understand the power of data-driven decision-making in entrepreneursh...
Posted on Dec 16, 2015 by Admin
Visit the SimplyMap team at the ALA Midwinter Meeting 2016 in Boston. We will be at booth #1913 offering product demonstrations, tips & tricks, and of course Ghirardelli Chocolate! Ex...
Posted on Nov 11, 2013 by Admin
Chad Boeninger, Business & Economics Subject Specialist at Ohio University Libraries has produced some excellent tutorial videos to help students learn how to analyze data and create ...
Posted on Dec 08, 2010 by Admin
The GRI team will be attending the American Library Association Midwinter meeting this year at the San Diego Convention Center. Visit us in booth 1055 in the exhibit hall from January 7 -...
Posted on Dec 15, 2014 by Admin
Visit the SimplyMap team at the ALA Midwinter Meeting in Chicago late January. We will be at booth #2824 offering product demonstrations, tips & tricks, and of course Ghirardelli Choc...
Posted on Feb 21, 2018 by Admin
We are looking forward to sharing SimplyAnalytics with the public library community at the upcoming PLA 2018 Conference in Philadelphia, PA. Our team will be exhibiting in Booth #855. Vis...