


Thanksgiving Data - Macy’s Parade
Posted on Dec 03, 2015 by Admin
With the Thanksgiving holiday last week, we decided to take a quick look into SimplyMap to see what pertinent variables are available for analysis.
First, open the Variables panel and click on Search. Type in “Thanksgiving” in the available box.
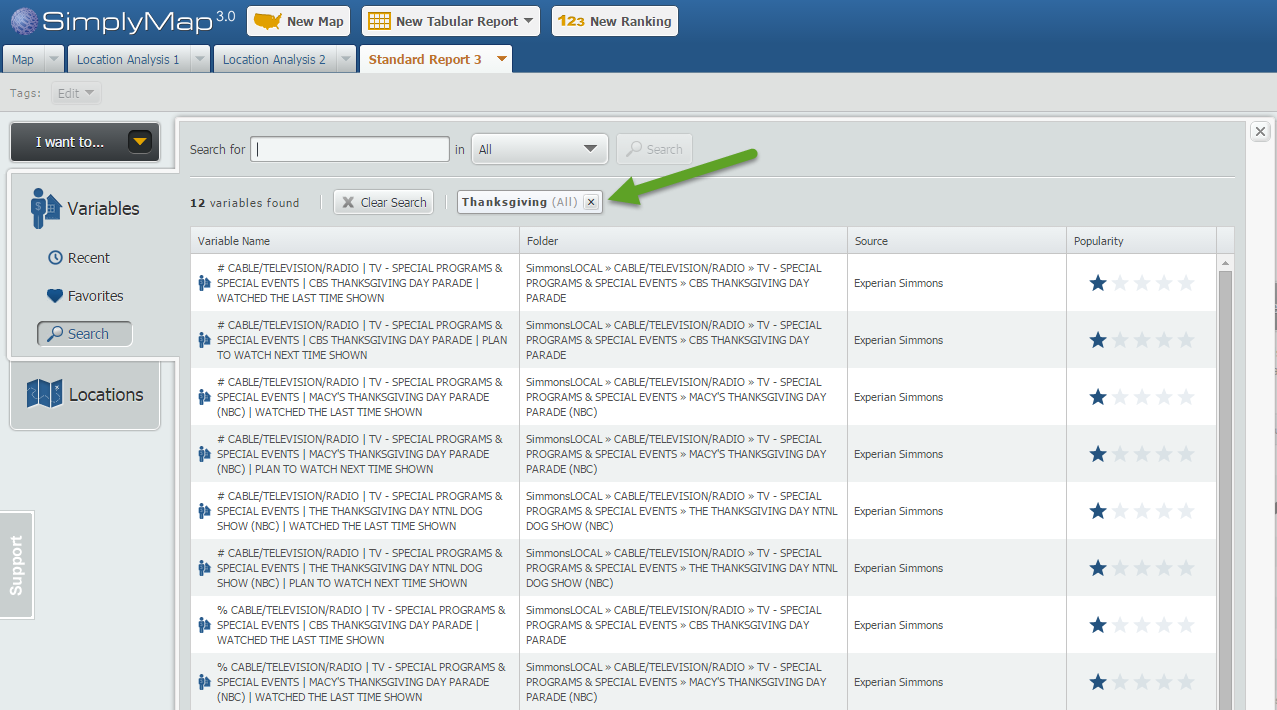
The results display a total of 12 variables related to the keyword ‘Thanksgiving’.For fun, we also searched the keyword: turkey. Care to take a guess how many turkey related variables are in SimplyMap?
If you guessed 122, you’re right! There is a grand total of 122 variables related to the word ‘turkey’, ranging from:
% Households Traveling - Foreign Travel (Including Alaska & Hawaii): Countries or destinations visited: Turkey, 2014
to variables such as:
% Households Using - Chicken & Turkey Fresh Or Frozen: Used in last 6 months, 2014
Interesting! Now returning to our original Thanksgiving search we decided to find out the estimated expected number of viewers for this year’s Macy’s Thanksgiving Parade.
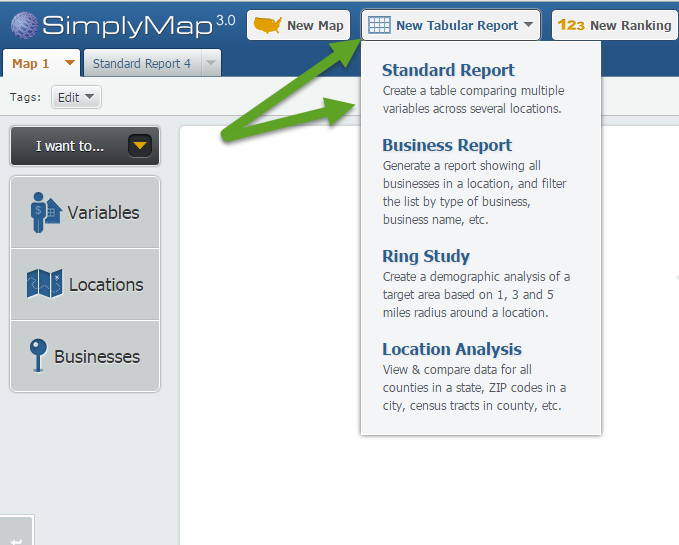
Click on New Tabular Report > Standard Report
The Thanksgiving variables are located in the SimmonsLOCAL folder. The SimmonsLOCAL data set is a premium add on module available for trial or purchase and includes over 60,000 data variables.
Navigate through this path: SimmonsLOCAL » CABLE/TELEVISION/RADIO » TV - SPECIAL PROGRAMS & SPECIAL EVENTS » MACY'S THANKSGIVING DAY PARADE (NBC)
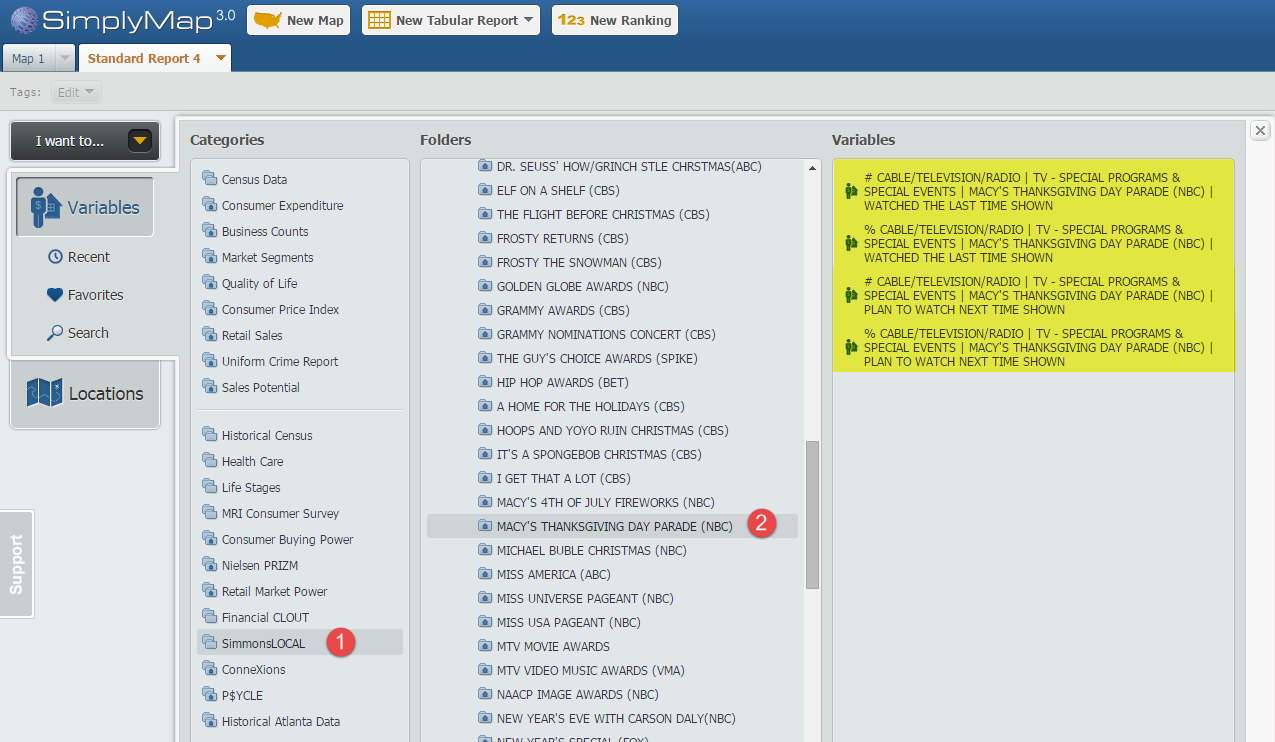
Choose the four variables within the folder, and close out the Variables panel to generate your report for the United States.
Results:
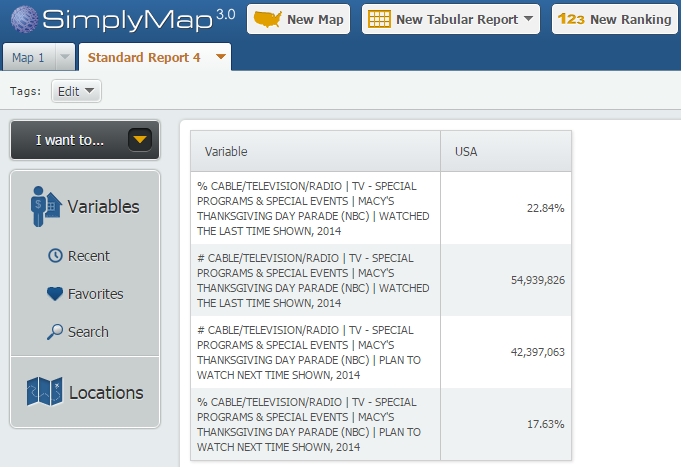
It’s estimated that over 54,000,000 people in the US responded that they had seen the Macy’s Thanksgiving Parade in 2014, with over 42,000,000 responding that they plan to watch the next event!
We hope you enjoyed this week’s report. Stay tuned for more SimplyMap tips and reports.
More from SimplyAnalytics
Posted on Sep 08, 2016 by Admin
One of our favorite uses of SimplyMap is to find data that validates our general assumptions and observations. For example, in a previous blog we wrote about the growth of tablet ownershi...
Posted on Nov 29, 2009 by Admin
Legal Information Alert, a monthly newsletter covering what's new in legal publications, databases and research techniques, published a review of SimplyMap in their April 2009 issue title...
Posted on Jul 20, 2020 by Admin
Hello readers! We hope you are doing well and staying safe. Today we are excited to introduce the Simmons NCS crosstabs functionality! This is a feature we’ve been working on for a while,...
Posted on Dec 11, 2023 by Admin
Hello readers! We have some fantastic news to share. SimplyAnalytics is thrilled to announce the addition of 2020 Election data to our expanding collection of powerful datasets. With this...
Posted on May 06, 2013 by Admin
The GRI team is looking forward to exhibiting at SLA 2013 at the San Diego Convention Center, June 9th through the 11th. The Special Libraries Association (SLA) is a nonprofit global orga...
Posted on Aug 13, 2015 by Admin
In this quick SimplyMap report, we use Census data to help us identify which city in the United States has the highest percentage of residents who reported walking to work as their mode o...
Posted on Aug 30, 2009 by Admin
Jeff Zaslow, Wall Street Journal columnist and co-author of the The Last Lecture, will speak at the Orlando, FL Public Library on Friday, September 11 at 7 p.m. Zaslow helped the late Ran...
Posted on Oct 27, 2017 by Admin
Welcome to our first ever SimplyAnalytics blog! Every Friday we’ll post a write up on a specific feature or highlight some interesting data in SimplyAnalytics. The goal of these posts is ...
Posted on Jan 18, 2009 by Admin
Michigan State University is offering their users a basic introduction to using SimplyMap. The 1.5 hour session will cover the basics of how to use SimplyMap to create maps and reports u...
Posted on Feb 01, 2009 by Admin
Want to know the top 10 wealthiest ZIP codes in your state? How about the top 25 counties with the most elderly residents? Duke University students can now easily answer these questions a...