 Go up
Go up


Exploring SimplyMap Data: Walking to Work in the US
Posted on Aug 13, 2015 by Admin
In this quick SimplyMap report, we use Census data to help us identify which city in the United States has the highest percentage of residents who reported walking to work as their mode of transportation. Have any cities in mind? Let’s find out!
First, click New Ranking from the top of your SimplyMap screen.

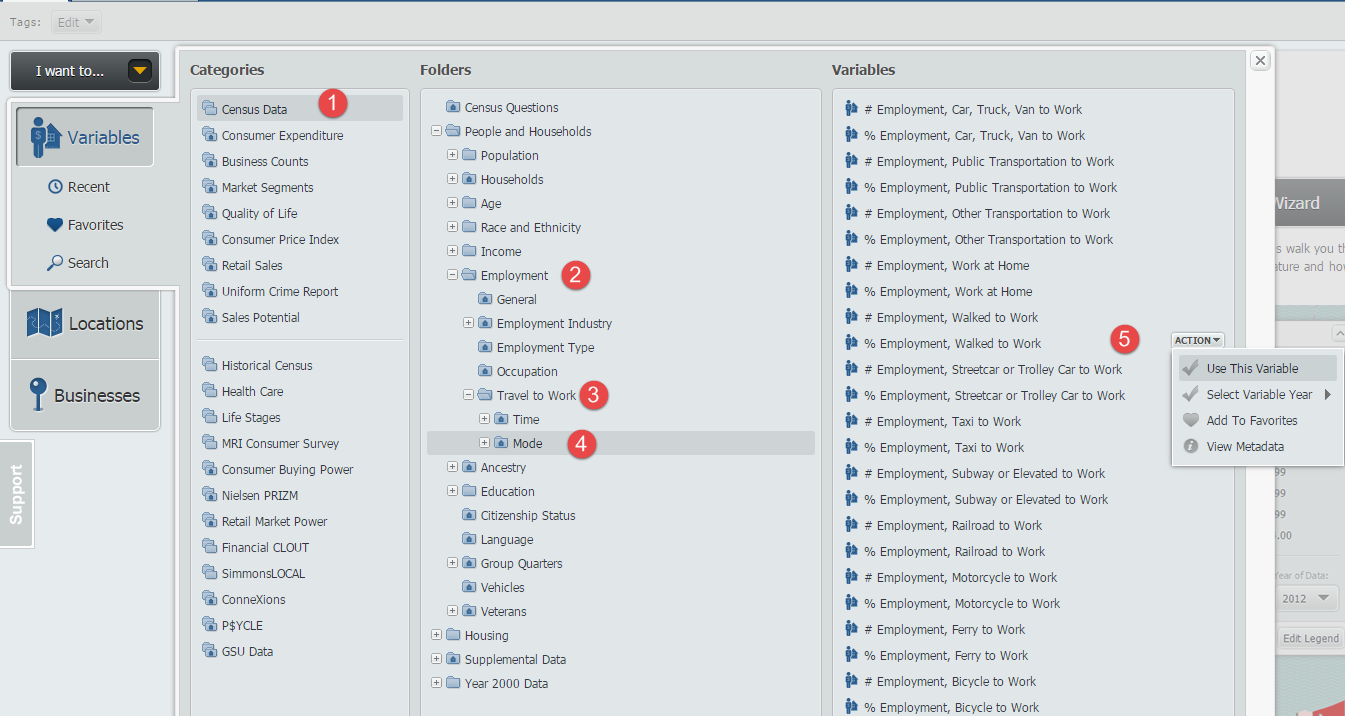
For the variable, follow this path: Census Data » People and Households » Employment » Travel to Work » Mode.
The variable we are looking for is, “% Employment, Walked to Work, 2014”. Picture below for reference.
Click on the Locations panel and select USA as your geography. By default, your report will generate with the Analyze Data By dropdown set to USA. As a good reference point, the USA shows a total of 2.78% of residents who walk to work. Before we analyze the US by city, let’s take a quick look at the US analyzed by top 10 states:

DC coming in with the highest percentage of residents who walk to work, at 12.27%, does not seem too surprising given the relative small land area and highly dense population (over 10,000 people per square mile!). Ranked second, Alaska was surprising to us, and we would be interested in researching more about that - if you know why, feel free to leave a comment below.
Now let’s look at large cities. Switch the Analyze Data By dropdown to Cities and apply a filter to only show cities with a population greater than 100,000. Results are shown below:
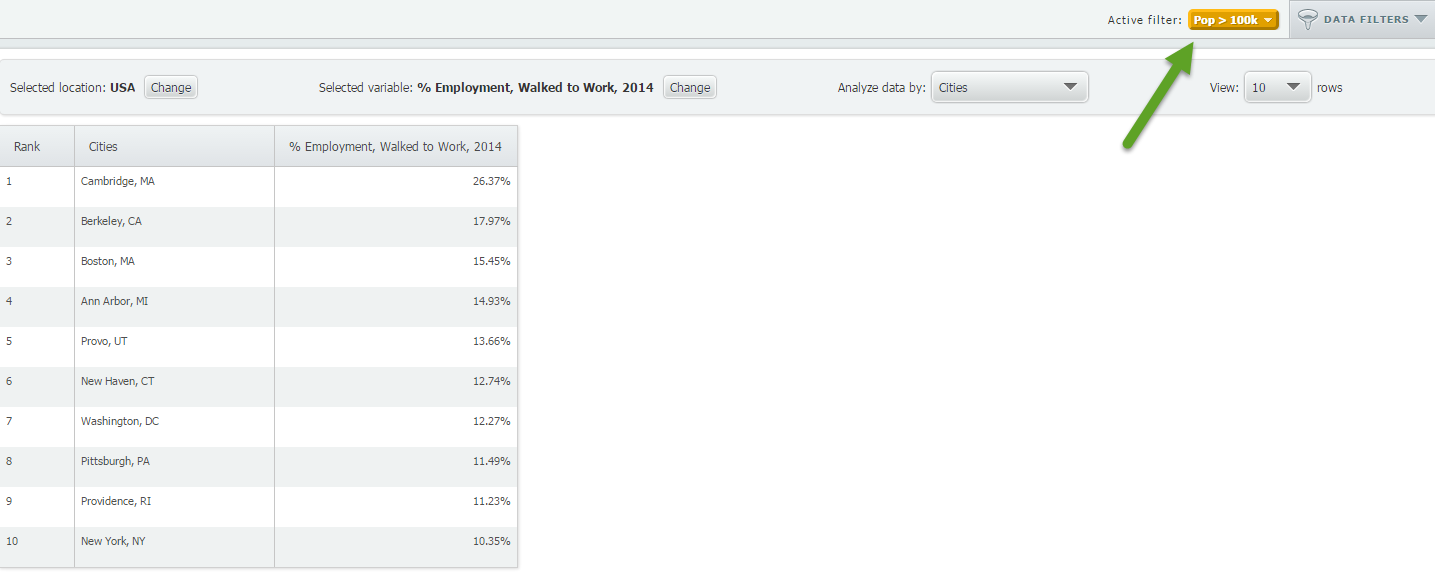
At 26.37%, more than a quarter of Cambridge, MA residents walk to work! We think this might be due to Harvard and MIT being the top employers in the city and within such close proximity to each other.
Honorable mention, and rounding out the top 5:
Berkeley - 17.97%
Boston - 15.45%
Ann Arbor - 14.93%
Provo - 13.66%
That’s it for this week’s SimplyMap report. If there is a particular variable or data package you want to see more of, let us know in the comments below or send us an email or tweet.
More from SimplyAnalytics


Posted on Feb 24, 2019 by Admin
Visit with the SimplyAnalytics team at this year's 14th annual Electronic Resources & Libraries Conference in Austin, TX! You can find us at Table 207, where we will be available to a...
Posted on May 15, 2015 by Admin
In this week’s SimplyMap report, we want to share with you the many options available when exporting maps in SimplyMap. In SimplyMap, when a user selects Export Map Image from the Actions...
Posted on Jul 22, 2015 by Admin
In this week’s SimplyMap report, we take a look at one of our newly available data packages - ConneXions® from Nielsen. The ConneXions® segmentation system integrates consumer behavior an...
Posted on May 31, 2011 by Admin
Kenneth Johnson of the Science, Industry, and Business Library at the New York Public Library recently provided a "boot camp" on the library's market research resources to budding entrep...
Posted on Oct 12, 2010 by Admin
NC LIVE, a member-driven library service organization dedicated to providing online information services that support education, enhance statewide economic development, and increase qu...
Posted on Mar 11, 2024 by Admin
We're thrilled to announce that SimplyAnalytics will be exhibiting at the ALA Annual Conference in San Diego! We can't wait to connect with library professionals, share insights, and show...
Posted on Oct 07, 2013 by Admin
Do you know the quickest way to find the name of a Block Group, Census Tract or ZIP code in our upcoming release for 3.0? The i-Tool gives you the ability to click anywhere on a map to g...
Posted on Oct 08, 2008 by Admin
Geographic Research, Inc. (GRI) is pleased to sponsor the fourth annual American Collegiate Retailing Association’s Undergraduate Student Retail Analysis Competition. This is the second ...
Posted on Apr 14, 2016 by Admin
This week’s SimplyMap report will provide an overview of one of the more advanced functionalities in SimplyMap - applying multiple filter conditions. Filters can be applied to any map or ...
Posted on Feb 21, 2018 by Admin
We are looking forward to attending our first Electronic Resources & Libraries (ER&L) conference in Austin, TX! Visit us at Table #510 for a closer look at SimplyAnalytics – the b...