Our Customers


What is SimplyAnalytics?
SimplyAnalytics is a web-based mapping, analytics, and data visualization application that makes it easy for anyone to create interactive maps, charts, and reports using 200,000+ data variables.
Answering questions using premium demographic, business, health, and marketing data has never been easier. Explore SimplyAnalytics today!
Features
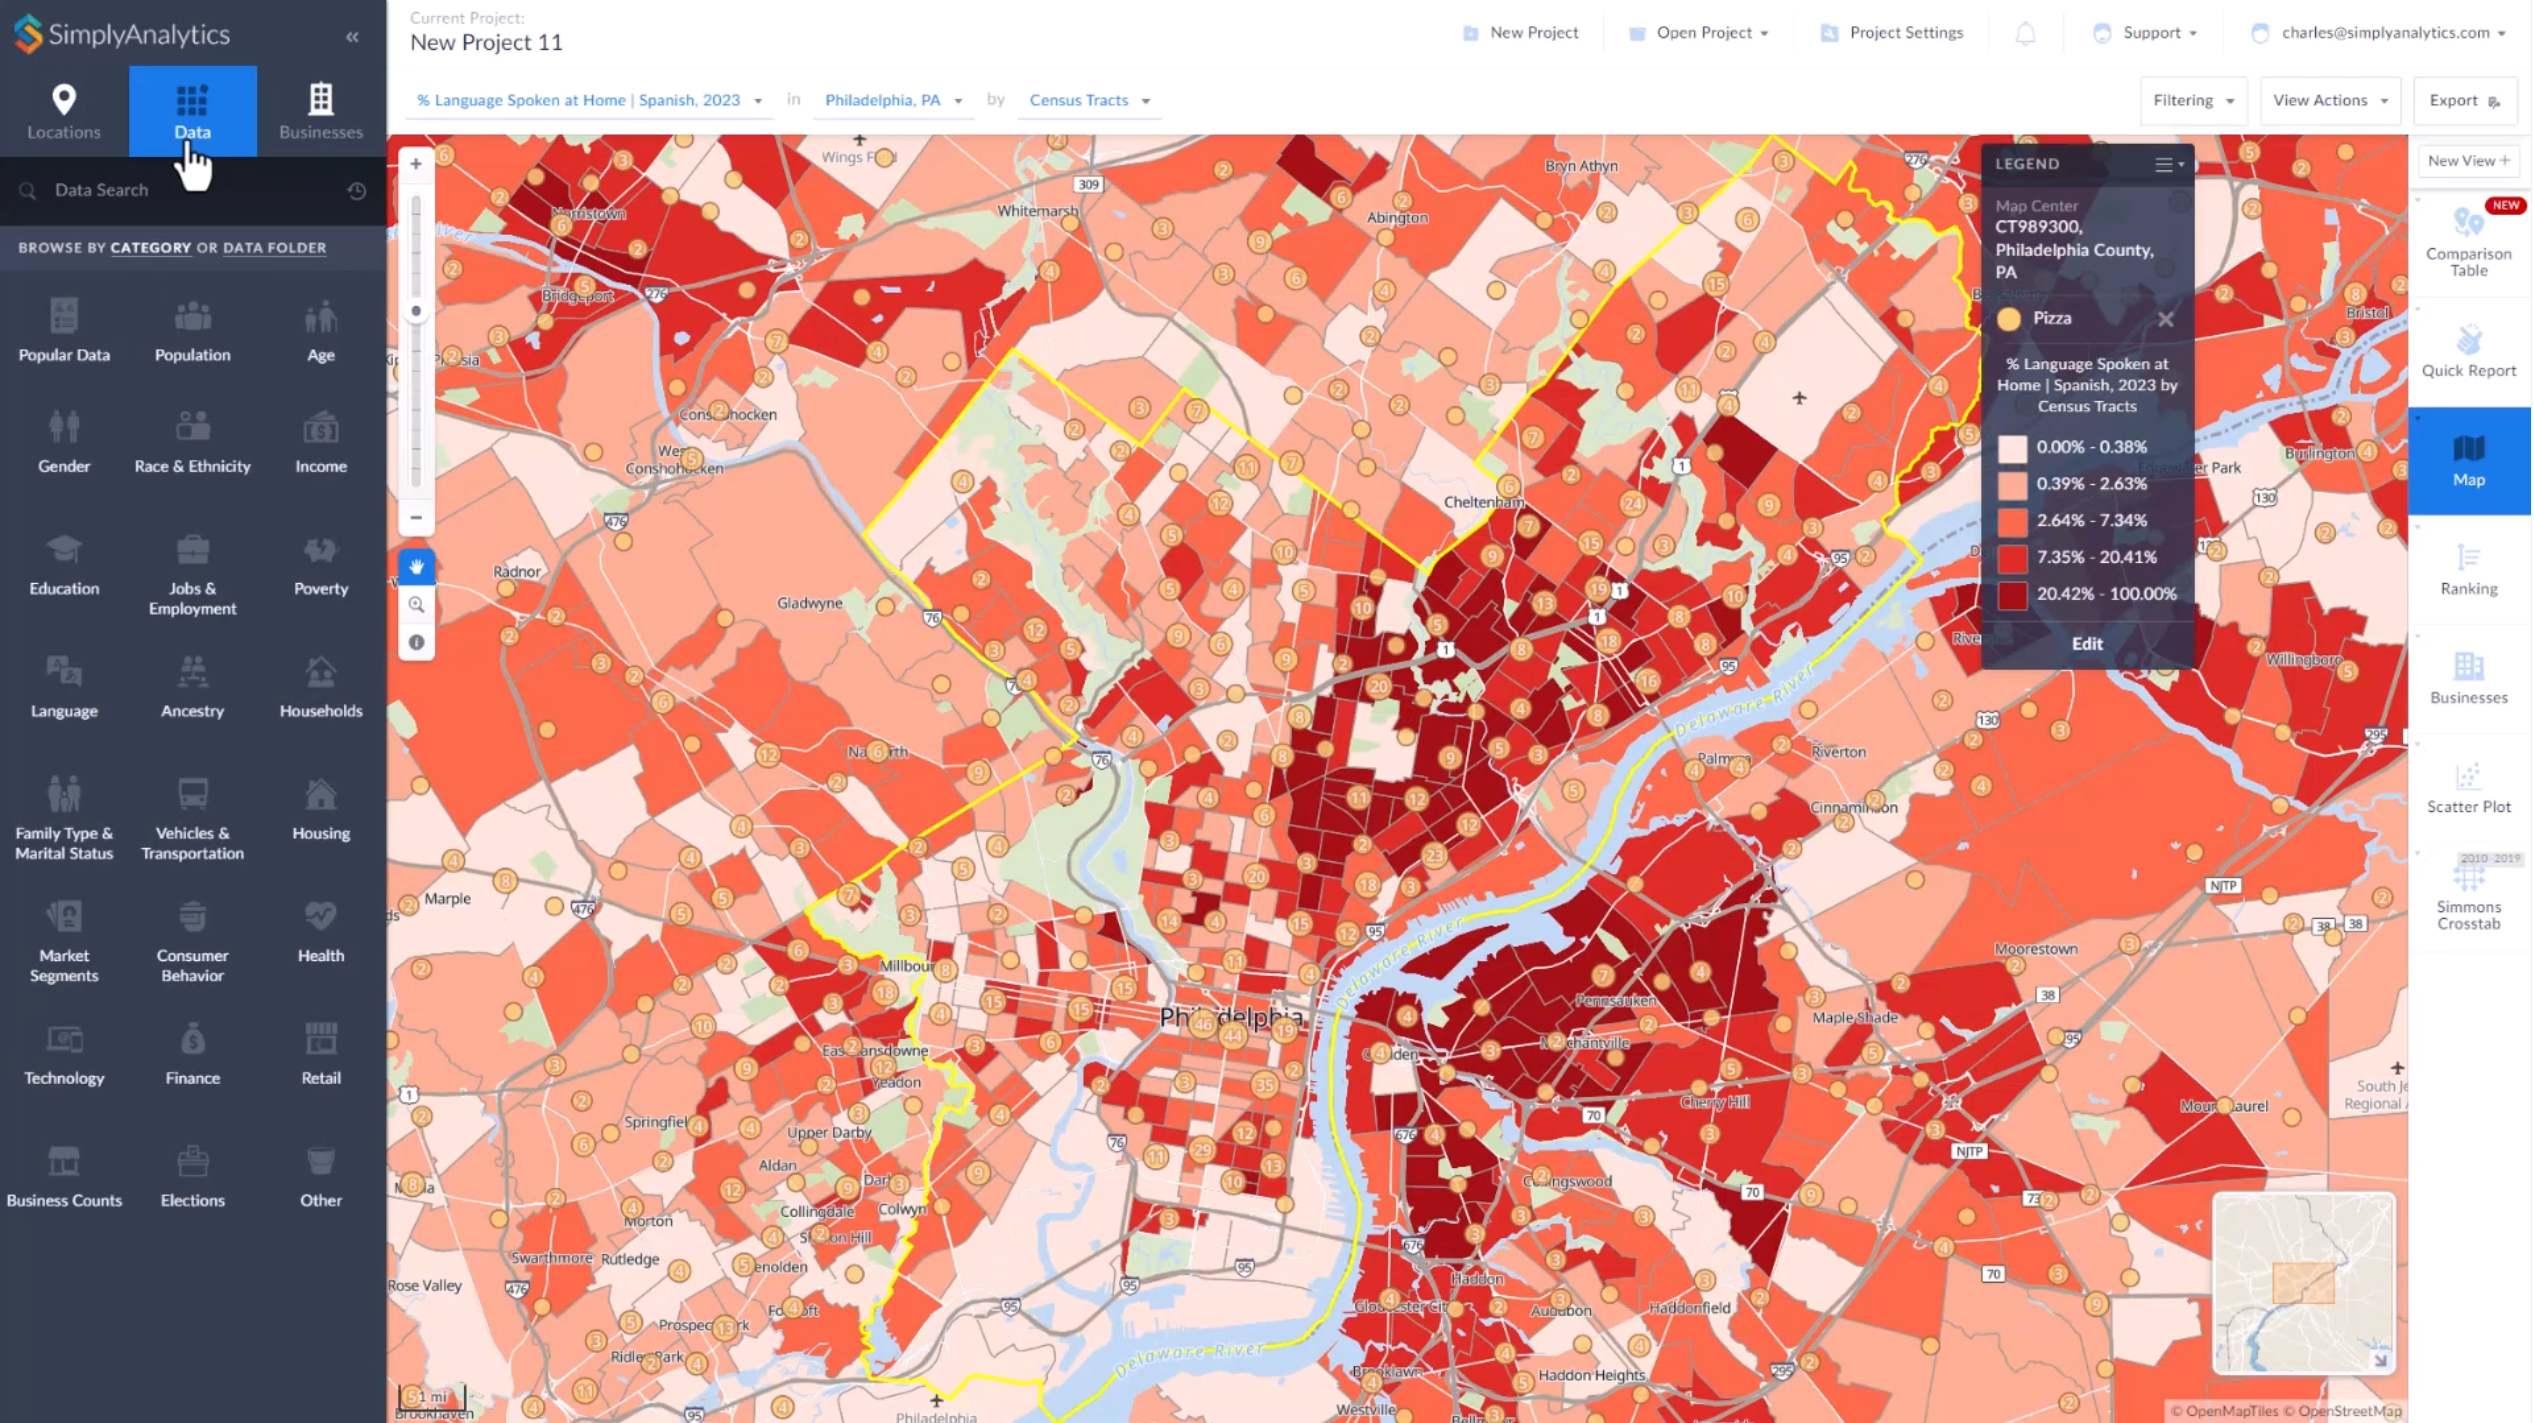
Create interactive maps using 200,000+ data variables. View data by state, county, ZIP Code, census tract, or block group, and easily customize every aspect of your map.
Create bar charts, histograms, and scatter plots with just a few mouse clicks.
Create ranking tables showing the top 100 wealthiest ZIP codes in your state, or identify the Census Tracts in your city with the most college educated residents.
Create informative crosstab tables using several of our consumer behavior survey datasets. For example, what are the demographic characteristics of specific website visitors? Who is most likely to purchase different brands of cars?
Add one data variable to this report and we will automatically add all of the related data for you. For example, if you add "Percent of Households with Income $50,000 to $74,999" the report will also show all of the other income ranges as well.
Identify your target areas in maps and reports using powerful location filters and queries. Locations that do not match your criteria are removed, leaving you with a clear and concise view of your matching locations.
SimplyAnalytics can generate seven different types of detailed, custom tabular reports for one or many locations. Create ranking tables showing the top 100 wealthiest ZIP codes in your state, or view a “quick report” with dozens of demographic variables for your census tract and county, or a ring study illustrating the characteristics of the 1-, 3-, and 5-mile radius surrounding your target location.
Import your academic, business, or marketing data into SimplyAnalytics and use it alongside all of our other data.
Export high-resolution images as PDFs, SVGs, JPEGs, or PNGs and place them into documents, presentations, and websites. Reports and data can be exported as Excel, CSV, or DBF files. Advanced users can export shapefiles for use in desktop GIS software.
SimplyAnalytics can generate seven different types of detailed, custom tabular reports for one or many locations. Create ranking tables showing the top 100 wealthiest ZIP codes in your state, or view a “quick report” with dozens of demographic variables for your census tract and county, or a ring study illustrating the characteristics of the 1-, 3-, and 5-mile radius surrounding your target location.
Powerful Data

Demographic
Population, age, gender, race, education, language, family type, housing, and more.

Economic
Income, poverty, employment, occupation, housing values, rent, and more.

Health
Diseases, diagnoses, doctor visits, procedures, health status, unhealthy behaviors, and more.

Business
Create maps and reports of 25M+ businesses, with employee count, total revenue and more.

Marketing
Market segments, life stages, technology use, financial products, retail sales, and more.

Consumer Spending
Food, housing, clothing, auto, entertainment, health, technology, media, travel, and more.

Historical
Decennial census for 1980, 1990, 2000, and 2010, as well as tons of data from 2007 to now.

Crosstab
Create custom crosstab tables from over 100,000 consumer behavior data variables.

Your data
Import your research, sales, marketing, customer, or patron data into SimplyAnalytics.
Our Data Partners


See How It
Works
See How It
Works
A versatile, multidisciplinary tool for research and analysis
Сlick on the question to get an answer
01
SimplyAnalytics Canada is also available!
02
Intuitive location-based business intelligence
03
Create maps, charts, reports and data tables
04
Over 200,000 data variables
05
Export shapefiles for use in GIS software
06
Import your own data
Reviews
What people say about our award-winning applications
Simplymap & Simplyanalytics

SimplyMap is an outstanding online subscription service…with surprisingly rich GIS analysis capabilities. Choice Magazine
SimplyAnalytics makes it easy to do market analysis at the local level. SimplyAnalytics has more options available for displaying data, including many different types of tables and statistics. The Charleston Advisor
SimplyMap is my favorite online tool that we offer. It’s powerful, easy to use, and capable of creating amazing data-driven maps and reports with little effort. Cumberland County Public Library