


SimplyMap Tip – Creating a Map from a Ranking Report
Posted on Nov 17, 2014 by Admin
Our recent series Exploring SimplyMap Data Reports has focused on creating ranking reports for unique variables. Accordingly, we thought it would be helpful to write a quick tip on how to create a map directly from the ranking results.
After creating a ranking report in SimplyMap, you can quickly create a map using any of the locations in your ranking. Let’s look at an example.
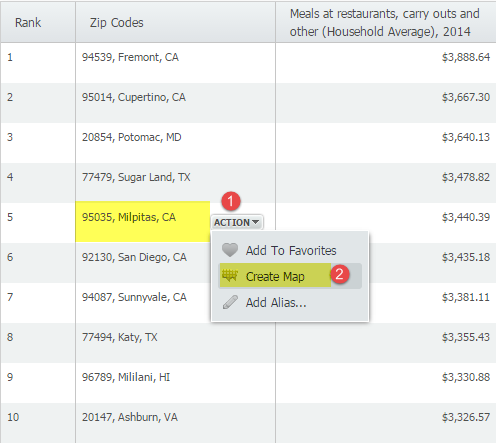
Our November 6 Report, “Which US Locations Dine Out the Most?” identified ZIP code 95035 in Milpitas, CA as the ZIP Code with the highest average spending on restaurant and carry out meals. We can find out exactly where it is located by mapping the location directly from the report by hovering over the location and selecting “Create Map” from the action dropdown, as shown below:
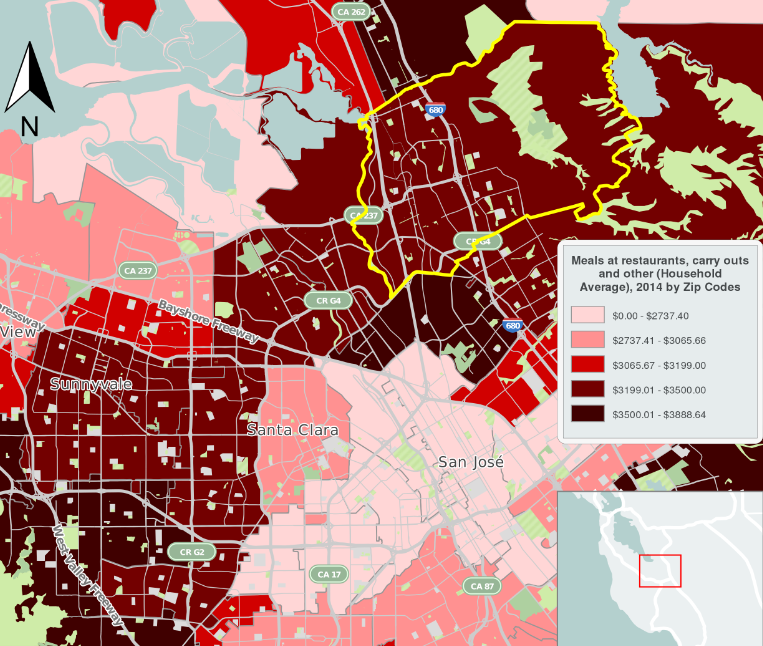
A map using the ranked variable (Meals at restaurants, carry outs and other (Household Average), 2014) will then be created. The image below shows an exported image of ZIP code 95035 in Milpitas, CA.
Stay tuned for more SimplyMap tips and tricks!
More from SimplyAnalytics
Posted on Sep 08, 2016 by Admin
One of our favorite uses of SimplyMap is to find data that validates our general assumptions and observations. For example, in a previous blog we wrote about the growth of tablet ownershi...
Posted on Jul 28, 2013 by Admin
We recently discovered some interesting data on participation and attitudes towards recycling, and decided to dig a bit deeper into our Experian SimmonsLOCAL data. This data package inclu...
Posted on Oct 07, 2024 by Admin
We're headed to Charleston! Come visit the SimplyAnalytics team on November 12th at the Gaillard Center at booth 41. We'll be doing live demonstrations of the database, answering question...
Posted on Feb 27, 2015 by Admin
SimplyMap is an excellent tool for market research, and it’s made even more powerful by Nielsen PRIZM data. Nielsen PRIZM is the highest quality market segment data available. Every house...
Posted on Apr 17, 2009 by Admin
The Special Libraries Association will hold its Annual Conference in Washington, DC at the Washington Walter E. Washington Convention Center from June 14-17 2009. The conference will crea...
Posted on Jun 09, 2021 by Admin
Hello readers! SimplyAnalytics will be exhibiting at the Virtual ALA Annual Conference this year on June 23-26. Be sure to drop by our booth, and click the banner image to video chat with...
Posted on Jan 17, 2011 by Admin
Come visit the Geographic Research booth at the Ontario Library Association Super Conference this season. The conference will take place on February 2-5, 2011 at the Metro Toronto Convent...
Posted on May 15, 2015 by Admin
In this week’s SimplyMap report, we want to share with you the many options available when exporting maps in SimplyMap. In SimplyMap, when a user selects Export Map Image from the Actions...
Posted on Nov 28, 2012 by Admin
Come visit the SimplyMap team at the ALA Midwinter Meeting, January 25 - 28, 2013 in Seattle, WA. We will be in Booth 1307, and as always we look forward to meeting with customers new and...
Posted on Sep 18, 2015 by Admin
With tens of thousands of variables available in SimplyMap, it’s common for users to wonder whether or not a particular variable they have in mind is available in SimplyMap. This is where...