


Exploring SimplyMap Data: Make of Vehicles
Posted on Aug 02, 2016 by Admin
Did you know that you can use SimplyMap to identify which make and model of vehicle is most prevalent within any location in the United States? In this week’s SimplyMap report, we’ll take a look at the SimmonsLOCAL data set to identify the top vehicle brands in select cities around the US. Let’s get started!
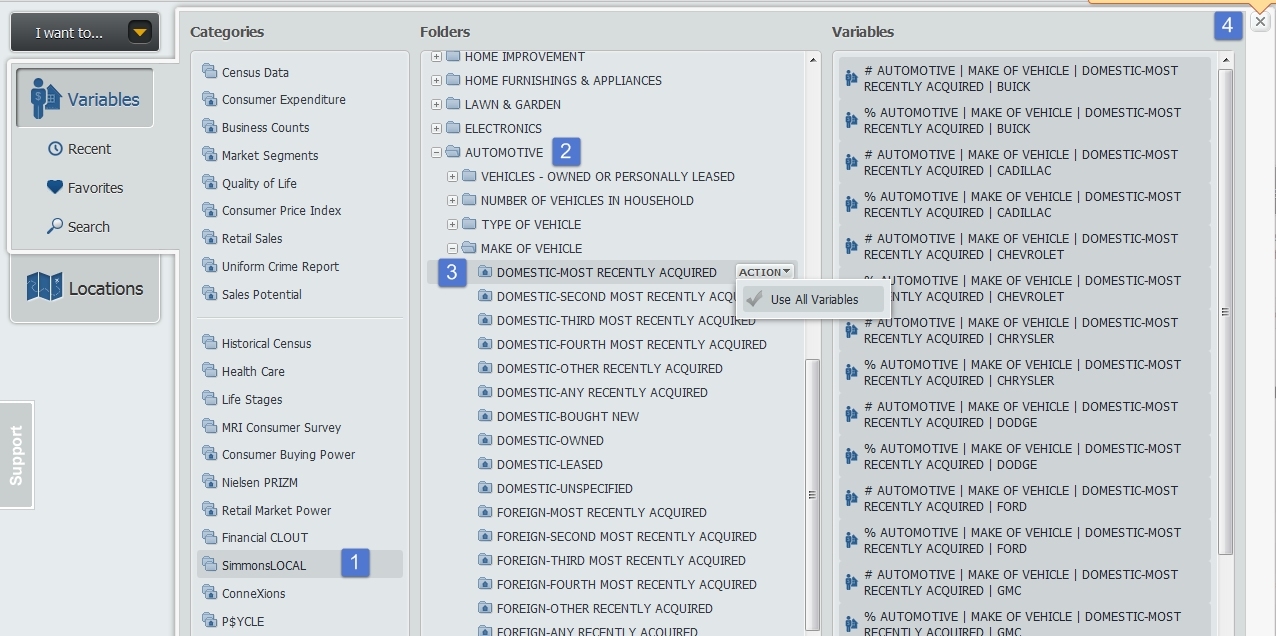
First, open up a Standard Report. For this example, we’ll focus on which domestic and foreign vehicles have been most recently acquired within our target areas. Accordingly, we will utilize the Use All Variables feature to add all variables within the two folders:
- DOMESTIC-MOST RECENTLY ACQUIRED
- FOREIGN-MOST RECENTLY ACQUIRED
When you close out the variables panel, a report for the United States is generated. Utilizing the Sort Descending feature, you can determine the top represented domestic and foreign cars that have been most recently purchased.
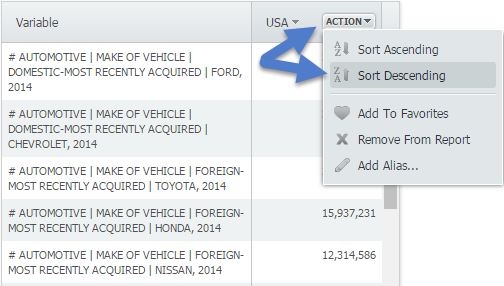
Results for the US:
- Ford - 34,042,678
- Chevrolet - 31,309,261
- Toyota - 24,672,205
- Honda - 15,937,231
- Nissan - 12,314,586
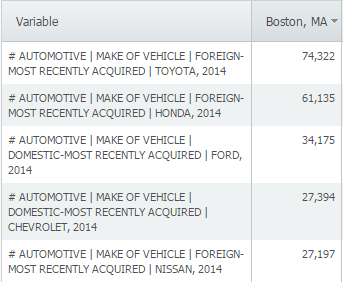
Now let’s take a look at the results for a few other cities:
Boston:
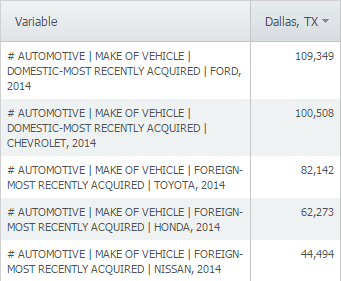
Dallas:
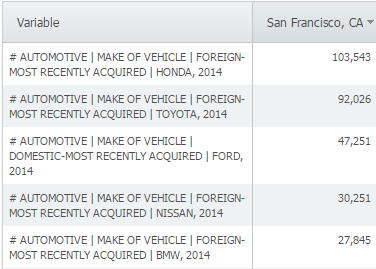
San Francisco:
If you want to see more detail on a particular model from a brand, utilize this path and add/sort all models from the brand: SimmonsLOCAL » AUTOMOTIVE » DOMESTIC VEHICLES - MAKE/MODEL » MOST RECENTLY ACQUIRED - DOMESTIC or FOREIGN
For example, looking at Boston, MA and adding all Toyota models reveals the following:
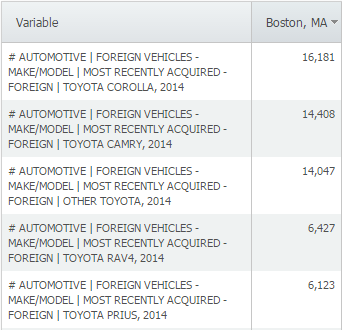
It looks like Boston is a big fan of Toyota Corollas. This data is available down to the block group level, so feel free to find out which make and model of vehicle is popular within your own neighborhood - stay tuned for more!
More from SimplyAnalytics
Posted on Apr 17, 2018 by Admin
The SimplyAnalytics team would like to congratulate Rachel Holder, MLS candidate at Indiana University for being selected as this year's recipient of the BRASS Student Travel Award! ...
Posted on Nov 06, 2013 by Admin
SimplyMap includes a number of helpful support tools; guided wizards available when and where you need them, detailed help files, and an online support center with FAQs and searchable kno...
Posted on Apr 30, 2020 by Admin
We find ourselves in the middle of an unprecedented crisis the likes of which most of us have never experienced before, and hopefully won’t have to experience again. There is the occasion...
Posted on Feb 19, 2016 by Admin
Drop by booth #857 at PLA 2016 to meet the SimplyMap team and learn more about the features and functions behind SimplyMap. Have a Ghirardelli Chocolate while we present SimplyMap and off...
Posted on Jan 17, 2011 by Admin
Come visit the Geographic Research booth at the Ontario Library Association Super Conference this season. The conference will take place on February 2-5, 2011 at the Metro Toronto Convent...
Posted on Oct 08, 2019 by Admin
Hello readers! This week’s “From the Help Desk” is short & sweet. Let’s get to it! Question: How do I analyze all of the states at once in a report? Answer: The Ranking Report allows ...
Posted on Feb 24, 2023 by Admin
We are excited to attend SCELCapalooza 2023, a three-day conference for academic and research librarians in Southern California. The Vendor Day showcase will take place on March 1st, 2023...
Posted on Nov 17, 2014 by Admin
Our recent series Exploring SimplyMap Data Reports has focused on creating ranking reports for unique variables. Accordingly, we thought it would be helpful to write a quick tip on how to...
Posted on May 15, 2015 by Admin
In this week’s SimplyMap report, we want to share with you the many options available when exporting maps in SimplyMap. In SimplyMap, when a user selects Export Map Image from the Actions...
Posted on Dec 11, 2015 by Admin
With the final week of the college football season in the books, and bowl game selections having just taken place, we wanted to search within SimplyMap to see if any data pertaining to co...