


From the Help Desk - Analyzing all States at Once
Posted on Oct 08, 2019 by Admin
Hello readers! This week’s “From the Help Desk” is short & sweet. Let’s get to it!
Question: How do I analyze all of the states at once in a report?
Answer: The Ranking Report allows you to analyze all of the smaller geographic units in one larger area. For example, all the states in the USA, all of the Census Tracts in a County, etc.
Ranking Reports are a default view in your project, so there are only a few steps required.
1. Open the Ranking Report from the list of Views on the right side of the SimplyAnalytics window
2. In your Ranking Report, set the location to be: USA
3. Set the appropriate dropdown to be: States
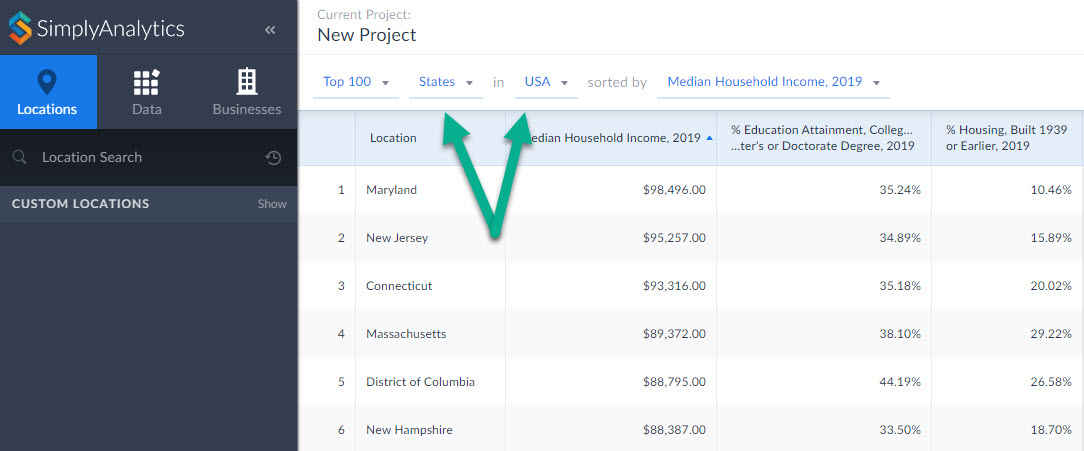
Your report will compile showing all the states in the USA. From there you are welcome to add in any variables of your choosing by selecting them from the list of recently used variables at the top of the report, or browsing the Data panel for additional variables.
That’s it for today! Stay tuned for more, and as always please do not hesitate to reach out to us with your questions to: support@simplyanalytics.com
More from SimplyAnalytics
Posted on May 24, 2023 by Admin
SimplyAnalytics is excited to attend. Swing by booth 1733 for a brief demo, and discover how our user-friendly demographics, business, health & marketing data analytics and visualizat...
Posted on Oct 26, 2018 by Admin
Welcome readers! This week we’ll take a look at how to browse for data by category in SimplyAnalytics. Browsing by Category is the default way of browsing for data in SimplyAnalytics. It ...
Posted on May 16, 2022 by Admin
Hello readers! We hope you are having a wonderful day. Today we feature a question from the help desk that we think many users would find useful. Let’s get started. The question: How can ...
Posted on Jul 20, 2020 by Admin
Hello readers! We hope you are doing well and staying safe. Today we are excited to introduce the Simmons NCS crosstabs functionality! This is a feature we’ve been working on for a while,...
Posted on May 10, 2016 by Admin
One benefit of data and applications like SimplyMap is the ability to visualize information. In this week’s report, we’ll take a quick look at some branding preferences in contiguous Amer...
Posted on Apr 17, 2018 by Admin
The SimplyAnalytics team would like to congratulate Rachel Holder, MLS candidate at Indiana University for being selected as this year's recipient of the BRASS Student Travel Award! ...
Posted on Sep 08, 2016 by Admin
One of our favorite uses of SimplyMap is to find data that validates our general assumptions and observations. For example, in a previous blog we wrote about the growth of tablet ownershi...
Posted on Mar 03, 2016 by Admin
In this week’s SimplyMap report we take a look into the SimmonsLOCAL dataset to determine which cities in America have the highest percentage of residents who consume organic food product...
Posted on Sep 15, 2025 by Admin
SimplyAnalytics will be attending the upcoming NCLA Conference in Winston-Salem October 14-17!