


Browsing for Data Variables: Category Search
Posted on Oct 26, 2018 by Admin
Welcome readers! This week we’ll take a look at how to browse for data by category in SimplyAnalytics. Browsing by Category is the default way of browsing for data in SimplyAnalytics. It includes robust filtering capabilities to quickly find the specific data you are looking for from among the thousands of variables in the database.
Suppose we want to find the percentage of females who are employed in the healthcare industry.
First, select the broadest appropriate category - Jobs & Employment.
The top left of the panel displays how many variables are related to Jobs & Employment.
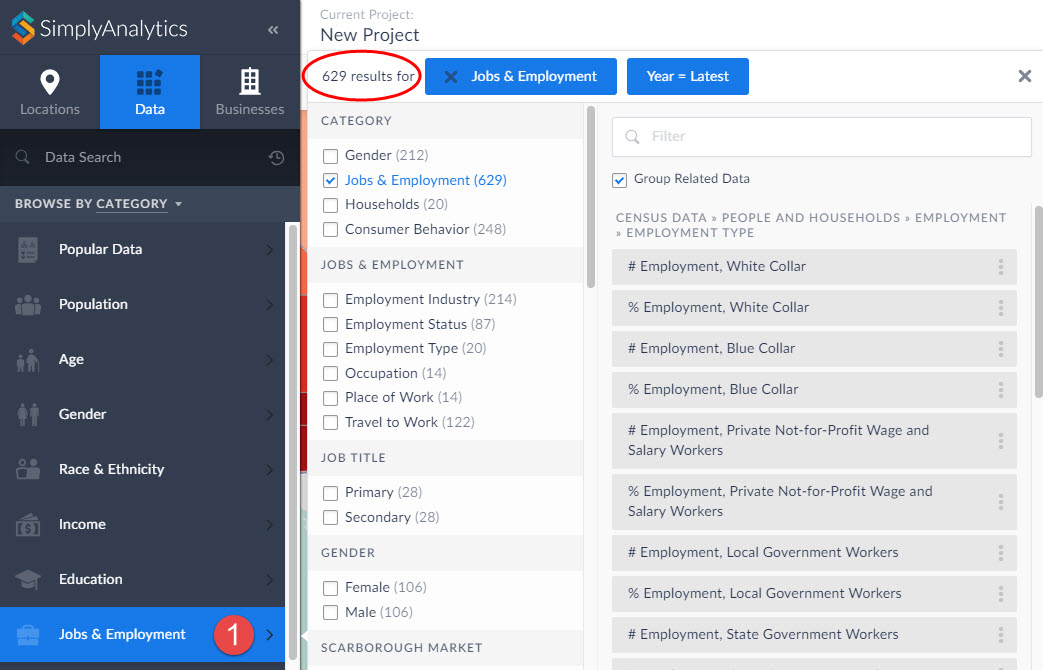
Notice in the image above you can search further within Jobs & Employment, and also specify a gender - scroll down to also choose a year, data type, and data set.
Click on the appropriate checkboxes to narrow down the options:
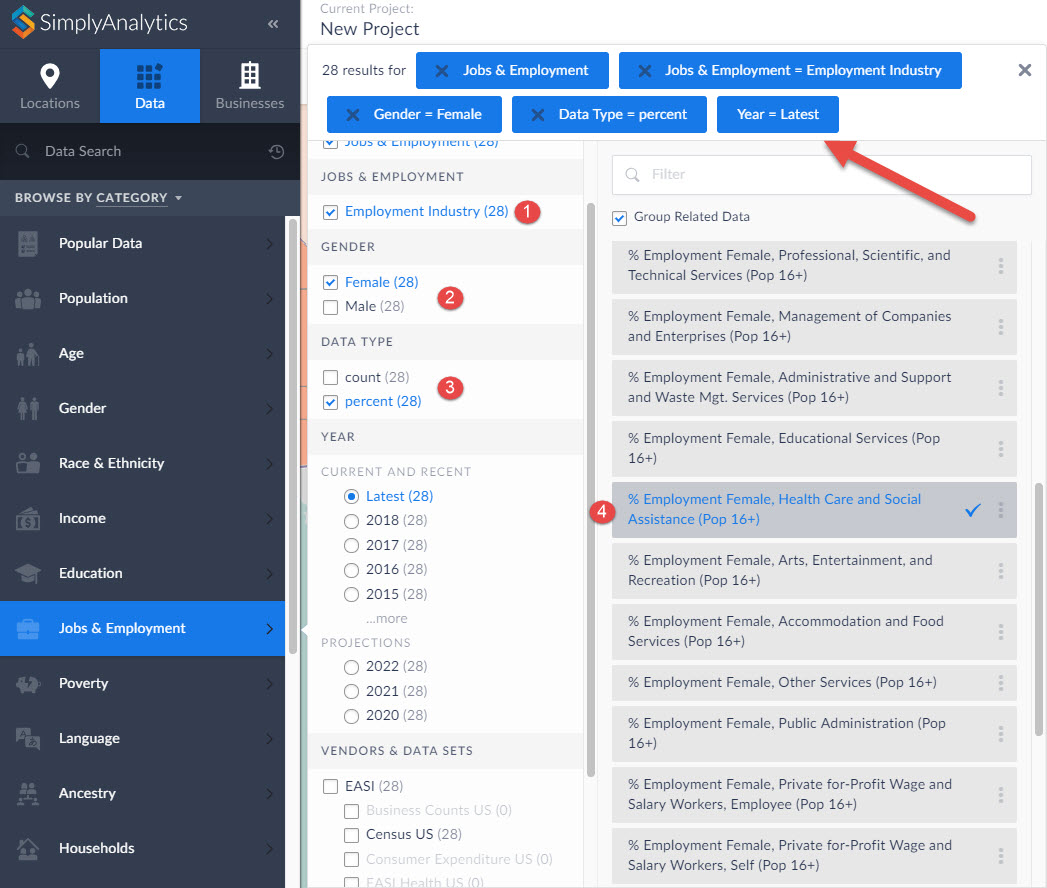
The list gets narrowed down to 28 results, and you can scroll down on the right-hand side to identify the target variable.
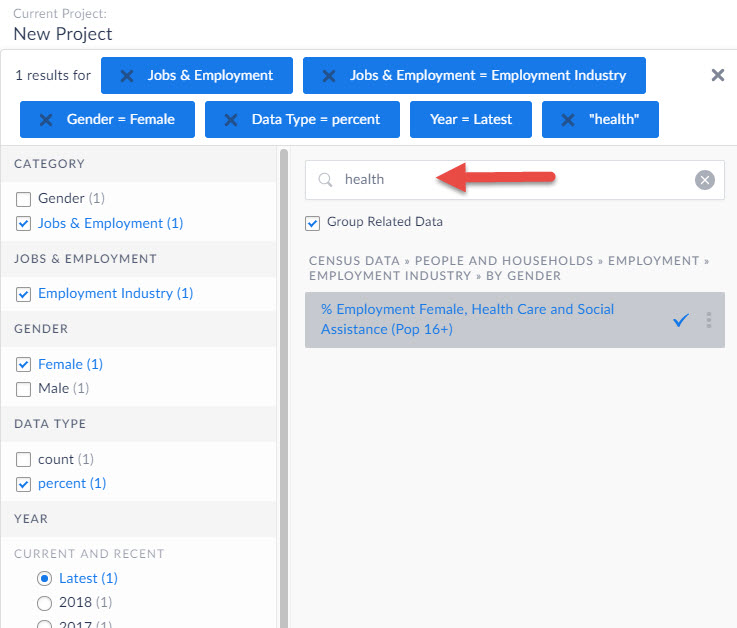
TIP: Notice the filter field within the panel - you can use this to quickly find specific data by entering a keyword in this field.
We hope you enjoyed this week’s write up - please let us know if there’s anything in particular you like to see in future posts!
More from SimplyAnalytics
Posted on Jan 17, 2011 by Admin
Come visit the Geographic Research booth at the Ontario Library Association Super Conference this season. The conference will take place on February 2-5, 2011 at the Metro Toronto Convent...
Posted on Dec 30, 2009 by Admin
Skokie Public Library, in Skokie, IL has published a useful overview of SimplyMap on the Mike's Space blog on SkokieNet. The article is filled with examples of research questions that can...
Posted on Jun 09, 2016 by Admin
In this week’s blog, we’ll be featuring our newest data offering, PRIZM® Premier. If your institution currently subscribes to PRIZM data, this new module is available at no additional cos...
Posted on Oct 07, 2024 by Admin
We're headed to Charleston! Come visit the SimplyAnalytics team on November 12th at the Gaillard Center at booth 41. We'll be doing live demonstrations of the database, answering question...
Posted on Jul 19, 2016 by Admin
Are you a tech wizard? Maybe you’re an apprentice? Learn more about technology consumption behaviors using the Simmons MOSAIC Technology Adoption segments located within the SimmonsLOCAL ...
Posted on Jun 07, 2011 by Admin
We will be exhibiting at the Special Library Association Annual Conference in Philadelphia and the American Library Association conference in New Orleans later this month. Come and visit ...
Posted on Jul 14, 2009 by Admin
Men's Health continues to utilize SimplyMap to identify and rank U.S. cities. This time they are studying "sports-obsessed citizenry," and here is how they did it: Our stat showdown began...
Posted on Jun 02, 2017 by Admin
We can't wait for ALA Annual this Summer, and the opportunity to share SimplyAnalytics with the ALA community. Stop by the SimplyAnalytics booth (1339) and take a peak at what we've been ...
Posted on Dec 11, 2015 by Admin
With the final week of the college football season in the books, and bowl game selections having just taken place, we wanted to search within SimplyMap to see if any data pertaining to co...
Posted on Oct 12, 2010 by Admin
NC LIVE, a member-driven library service organization dedicated to providing online information services that support education, enhance statewide economic development, and increase qu...