


Exploring SimplyMap Data - Organic Food Use
Posted on Mar 03, 2016 by Admin
In this week’s SimplyMap report we take a look into the SimmonsLOCAL dataset to determine which cities in America have the highest percentage of residents who consume organic food products. Let’s jump right in.
Before we rank the variable, % FOOD - GENERAL | ORGANIC FOODS | ORGANIC FOODS - HH USES? | YES, 2014 let’s do a quick search for “organic” to see how many related variables are in SimplyMap. Open the Variables tab, click on Search, and type in “organic”.
You will then get a list of all variables in SimplyMap that contain the keyword organic.
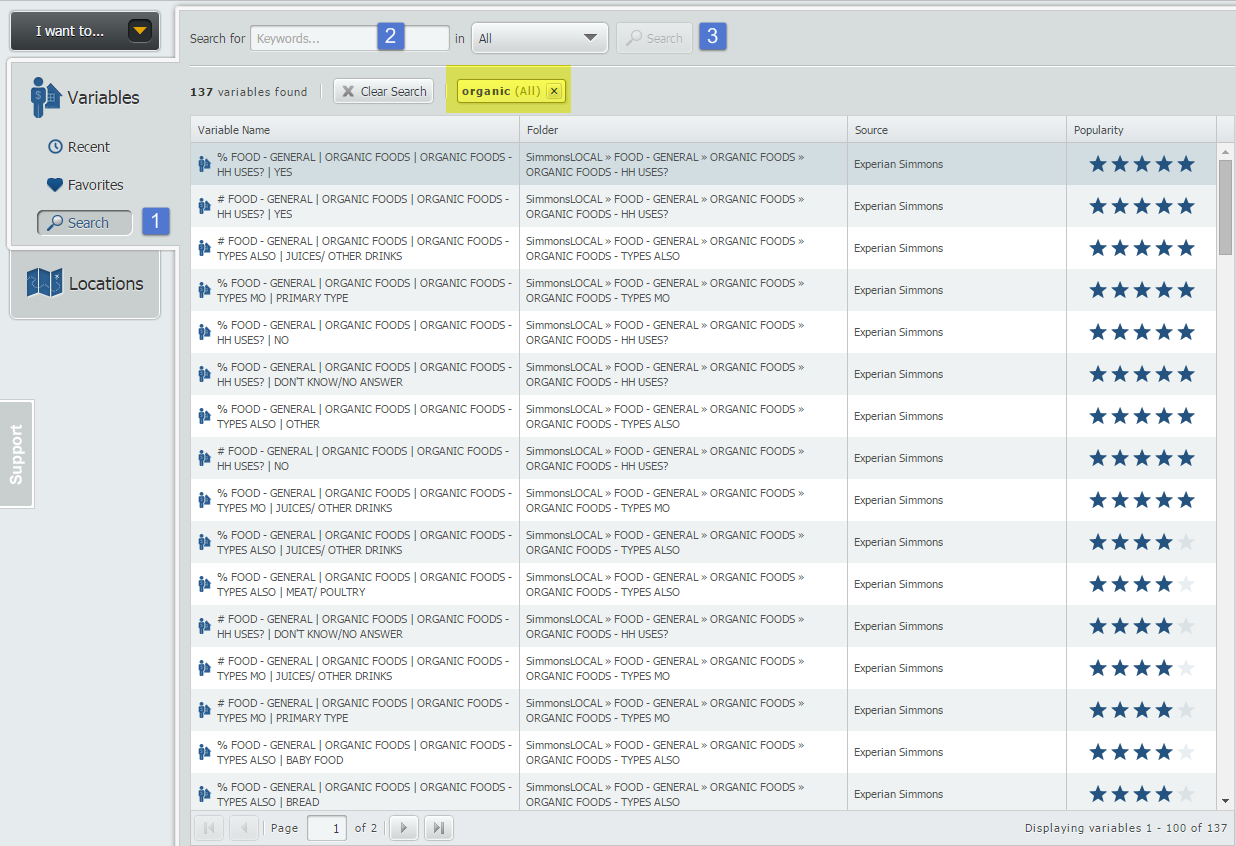
SimplyMap has a grand total of 137 “organic” associated variables across all datasets (the majority being within the SimmonsLOCAL package) with variables such as organic bread, and organic baby food use. Interesting!
It’s helpful to see what the US percentage is for our organic usage variable. This will help get a sense of the cities compare to the national total. Create a Standard Report with the US as your location, and the variable % FOOD - GENERAL | ORGANIC FOODS | ORGANIC FOODS - HH USES? | YES, 2014.
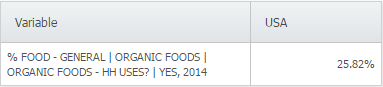
It looks like roughly one-quarter of the US claim to consume organic foods. On to the ranking.
Click on New Ranking at the top of SimplyMap. Next, select Recent from the Variables panel to quickly find and rank the variable used above. Lastly, set the Analyze Data By dropdown to Cities. Results below!
Note: We applied a population filter of > 200,000 residents to remove any percentages that might be unusually high due to a small population total.
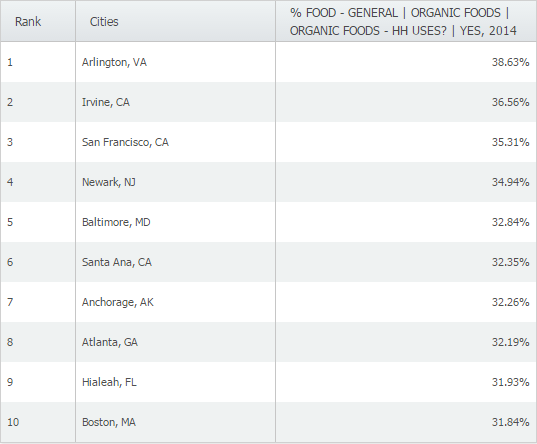
Any surprises in the results above?
We hope you enjoyed this week’s SimplyMap report. Stay tuned for more!
More from SimplyAnalytics
Posted on Feb 19, 2016 by Admin
Drop by booth #857 at PLA 2016 to meet the SimplyMap team and learn more about the features and functions behind SimplyMap. Have a Ghirardelli Chocolate while we present SimplyMap and off...
Posted on Dec 11, 2015 by Admin
With the final week of the college football season in the books, and bowl game selections having just taken place, we wanted to search within SimplyMap to see if any data pertaining to co...
Posted on Jan 05, 2018 by Admin
The SimplyAnalytics team is looking forward to exhibiting at the Ontario Library Association Super Conference 2018! Stop by the SimplyAnalytcs booth (115T) and take a look at our newest o...
Posted on Dec 08, 2010 by Admin
The GRI team will be attending the American Library Association Midwinter meeting this year at the San Diego Convention Center. Visit us in booth 1055 in the exhibit hall from January 7 -...
Posted on Feb 02, 2024 by Admin
We are excited to be back exhibiting at PLA this April in Columbus, OH. Join us at Booth #2631 to discover how SimplyAnalytics can help libraries understand their service area, assist sma...
Posted on Nov 06, 2014 by Admin
With over 75,000 variables in SimplyMap, you can find virtually any information you want. This week, we take a look at which U.S. locations spend the most money eating at restaurants or c...
Posted on Sep 15, 2016 by Admin
While creating a radius location is the fastest and easiest method for creating a custom location, there may be situations that require a more specific and targeted locale. Let’s say for ...
Posted on May 28, 2009 by Admin
The Charleston Advisor, which publishes critical reviews of online resources for libraries, published a review of SimplyMap in April. We are very pleased to have received 4 1/4 stars out...
Posted on Dec 06, 2009 by Admin
ALA's Choice Magazine, publisher of independent reviews of products and services for academic libraries, released a new review of SimplyMap in the December 2009 edition. The reviewer, Car...
Posted on Jul 09, 2009 by Admin
The American Library Association 2009 Annual Conference will take place in Chicago, IL from July 9- July 15, 2009 at McCormick Place West located at 2301 S. Lake Shore Drive Chicago, IL. ...