


From the Help Desk: How do I analyze data for downtown?
Posted on Nov 06, 2019 by Admin
Hello readers! We hope you’re having a wonderful week. Today we feature another entry from our From the Help Desk series. Let’s get started!
Question: How do I analyze data for downtown?
Answer: Use the combination location feature. The combination location feature enables users to combine locations of similar geographies to form one larger area. SimplyAnalytics will calculate all number, percent, and average data variables for the custom area. Here’s how to do that.
- Click on the Locations button (1), and select the Custom Locations heading (2). From there, select Create New Combination Location (3). Enter the name for your location in box 1 (4).
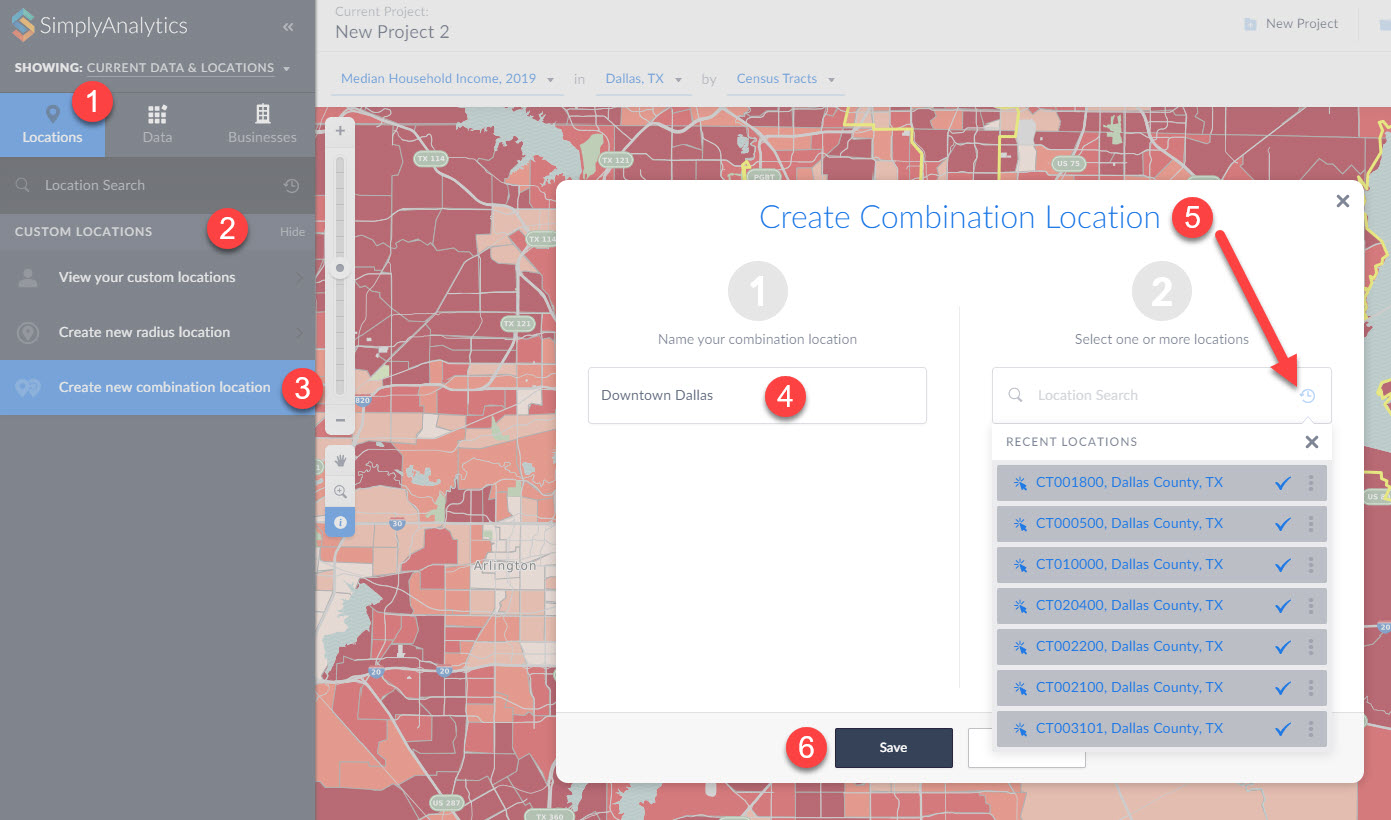
(5) If you have a list of locations that make up your custom location, you can enter them into box number 2. Alternatively, if you have previously used or favorited locations, you can easily access them by clicking on the respective icons within the Locations option as shown in step 5 above. (6) Click Save.
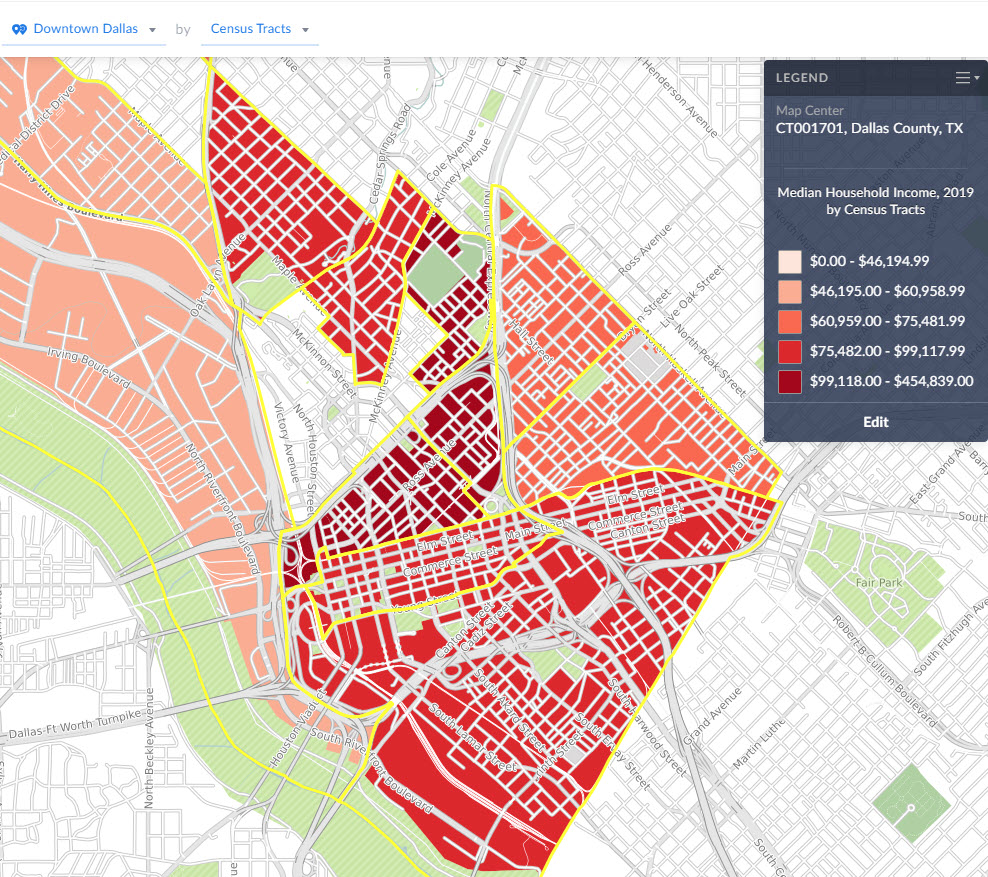
Your new location gets created and can now be mapped or used with any of the available reports in SimplyAnalytics:
That’s all we have for today - stay tuned for more!
More from SimplyAnalytics
Posted on Nov 19, 2019 by Admin
Hello readers! Today we are bringing you a new blog entry inspired by a recent Help Desk question. If you ever have any questions about SimplyAnalytics, please do not hesitate to reach ou...
Posted on Aug 13, 2015 by Admin
In this quick SimplyMap report, we use Census data to help us identify which city in the United States has the highest percentage of residents who reported walking to work as their mode o...
Posted on Oct 16, 2015 by Admin
Did you know that SimplyMap includes the ability to export Shapefile data for use in desktop mapping software (such as MapInfo or ArcGIS)? This advanced feature extends the power of Simpl...
Posted on Sep 05, 2019 by Admin
We are pleased to be exhibiting again at the Charleston Library Conference, on Tuesday November 5th, 2019. The Vendor Showcase will be held in the Gaillard Center Grand Ballroom (95 Calho...
Posted on Mar 21, 2011 by Admin
Men's Health magazine decided to crown one town America's Most Socially Networked City, and has generated quite a buzz in the process. Their survey examined the number of Facebook and Li...
Posted on Apr 28, 2016 by Admin
In this week’s SimplyMap report we’ll take a look at one of our newer data packages offered, P$YCLE® by Nielsen. P$YCLE® is a segmentation system that evaluates consumers using key demogr...
Posted on May 19, 2015 by Admin
We will be attending ALA this summer in San Francisco (hint: dress warm!). Visit us at Booth 413 and don't forget to enter our raffle - we will be giving away a $100 gift certificate to A...
Posted on Jun 08, 2015 by Admin
In this week’s report we take a look at one folder found within SimplyMap’s SimmonsLOCAL data package. SimmonsLOCAL is a powerful targeting and profiling system that provides insights int...
Posted on Sep 15, 2025 by Admin
SimplyAnalytics will be attending the upcoming NCLA Conference in Winston-Salem October 14-17!
Posted on Jan 15, 2013 by Admin
The GRI team is looking forward to exhibiting at ACRL 2013 at the Indiana Convention Center in Indianapolis April 10 - 12, 2013. Every other year, ACRL offers its premier professional dev...