


Exploring SimplyMap Data: SimmonsLOCAL Lifestyle Statements
Posted on Jun 08, 2015 by Admin
In this week’s report we take a look at one folder found within SimplyMap’s SimmonsLOCAL data package. SimmonsLOCAL is a powerful targeting and profiling system that provides insights into consumer behavior for all of America's 210 media markets on a local level with 60,000+ data variables, including over 450 categories and 8,000 specific brands.
The folder we are looking at today is the Lifestyle Statements folder. Here you will find 26 unique lifestyle statement subcategories ranging from attitude and opinions on apparel, to diet and health statements. The picture below shows the options available.
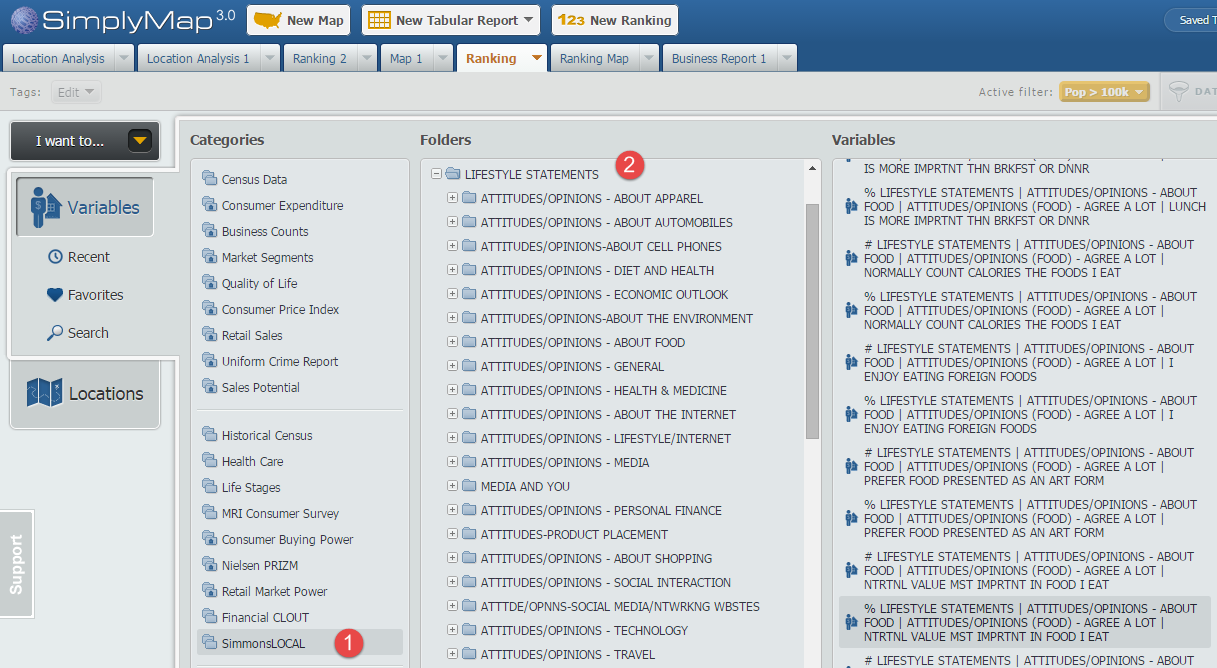
In this showcase we will create a Ranking Report using the variable statement AGREE A LOT - NUTRITIONAL VALUE MOST IMPORTANT IN FOOD I EAT. This can be found at this path:
SimmonsLOCAL » LIFESTYLE STATEMENTS » ATTITUDES/OPINIONS - ABOUT FOOD » ATTITUDES/OPINIONS (FOOD) - AGREE A LOT
First, select New Ranking found at the top of SimplyMap. Next, click on Variables and navigate through the above path to locate the variable.
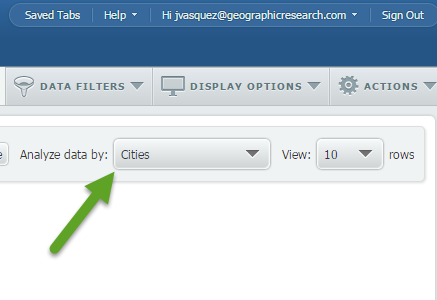
Under locations, select USA as your geography and use the Analyze Data By functionality to select Cities.
Apply a population filter (read more about using filters here) to only show cities with 100,000 or more residents, and the final result will look like this:
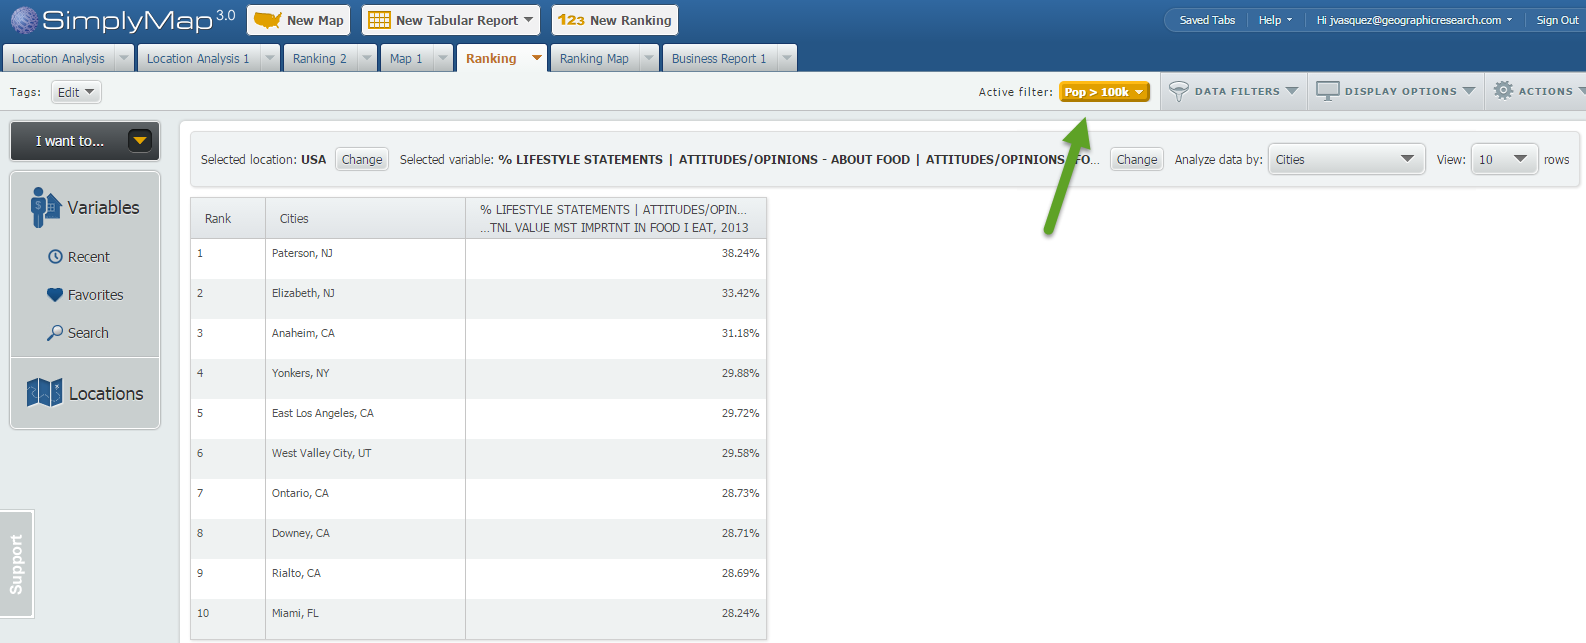
Note: you can see your applied filter located towards the top of your report by the Active Filter text.
At 38.24% Paterson, NJ ranks first in the United States (cities > 100k) for folks who agree a lot with the statement: NUTRITIONAL VALUE MOST IMPORTANT IN FOOD I EAT.
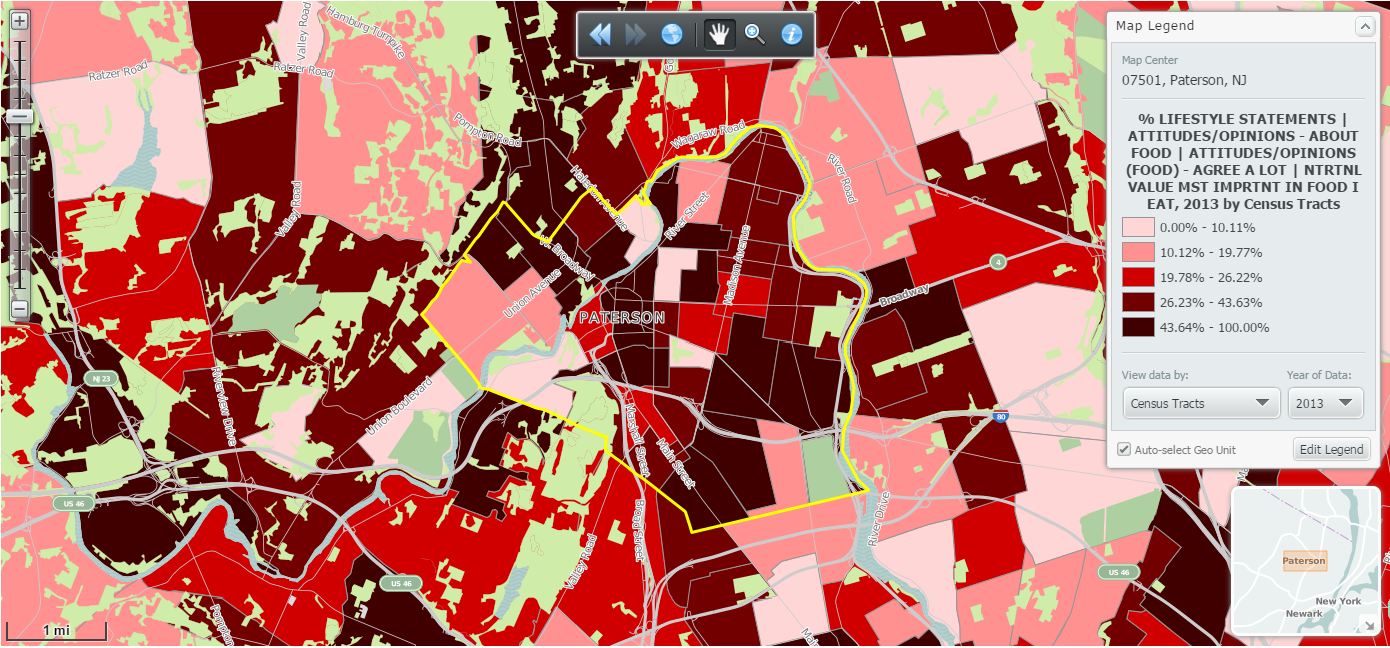
To quickly map Paterson, NJ hover over the location and select Create Map:
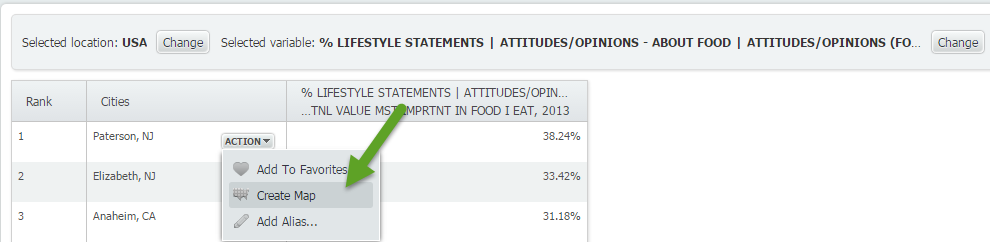
Map of Paterson, NJ:
We hope you enjoyed this look into the SimmonsLOCAL data set. With over 60,000 variables in the package, we will be posting many more variable spotlight reports.
Don’t forget to follow us on Twitter, and Like Us on Facebook to stay up to date with SimplyMap.
More from SimplyAnalytics
Posted on Sep 15, 2025 by Admin
SimplyAnalytics will be attending the upcoming NCLA Conference in Winston-Salem October 14-17!
Posted on Jun 02, 2017 by Admin
We will be exhibiting at SLA in Phoenix, AZ on June 18th-20th. You can find the SimplyAnalytics team at Booth #905. Stop by and check out our groundbreaking new interface, have a chocolat...
Posted on Feb 16, 2009 by Admin
Men's Health conducted their first survey of America's recycling habits, and used SimplyMap in their research. Here’s how the editors explain their methodology: To determine how well citi...
Posted on Dec 15, 2014 by Admin
Stop by the Geographic Research booth at the Ontario Library Association Super Conference to check out SimplyMap Canada. The conference will take place January 28-31 at the Metro Toronto ...
Posted on Sep 18, 2015 by Admin
With tens of thousands of variables available in SimplyMap, it’s common for users to wonder whether or not a particular variable they have in mind is available in SimplyMap. This is where...
Posted on Feb 05, 2015 by Admin
In this week’s edition of exploring SimplyMap data, we take a look at America’s coffee drinkers. SimplyMap contains more than 100 coffee related variables, including consumer spending on ...
Posted on May 28, 2009 by Admin
The Charleston Advisor, which publishes critical reviews of online resources for libraries, published a review of SimplyMap in April. We are very pleased to have received 4 1/4 stars out...
Posted on Jan 18, 2008 by Admin
The BRASS Business Reference Sources Committee of Reference & User Services Quarterly (RUSA) selected SimplyMap as one of the Outstanding Business Reference Sources for 2007. Excerpt...
Posted on Jul 28, 2013 by Admin
We recently discovered some interesting data on participation and attitudes towards recycling, and decided to dig a bit deeper into our Experian SimmonsLOCAL data. This data package inclu...
Posted on Jul 30, 2008 by Admin
Cornell’s Albert R. Mann Library has subscribed to SimplyMap. They provide some tips and access to the SimplyMap Quick Reference Guide, variable list, and some information on the EASI dat...