


Creating a Custom Location from a Map
Posted on Sep 15, 2016 by Admin
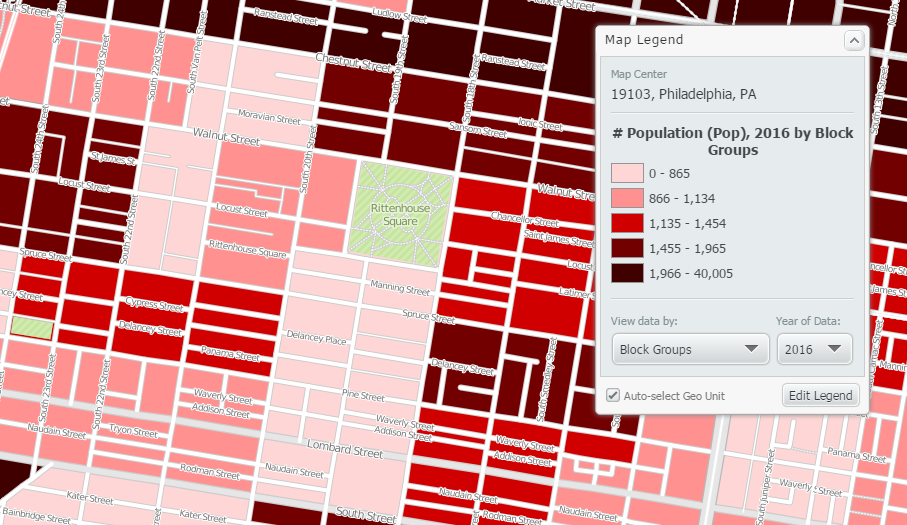
While creating a radius location is the fastest and easiest method for creating a custom location, there may be situations that require a more specific and targeted locale. Let’s say for example that our target area for analysis are a few neighborhoods located west of Rittenhouse Square Park in Philadelphia.
A radius location would not work in this example as it will include all areas within a defined radius (e.g., 5 miles) around a specific block group. Using the process outlined below will allow you to focus in on the specific areas west of Rittenhouse Square Park, and create a custom location directly from a map. Let’s get started!
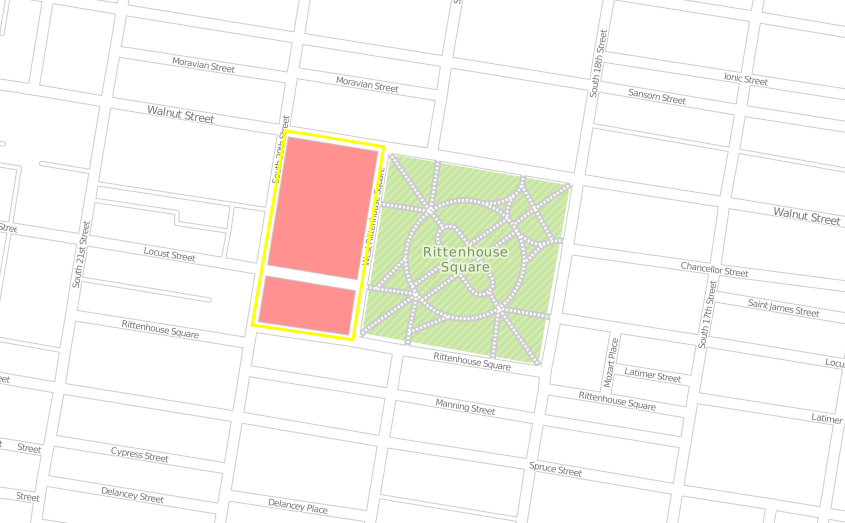
First, zoom in on the target area that will make up the custom location.
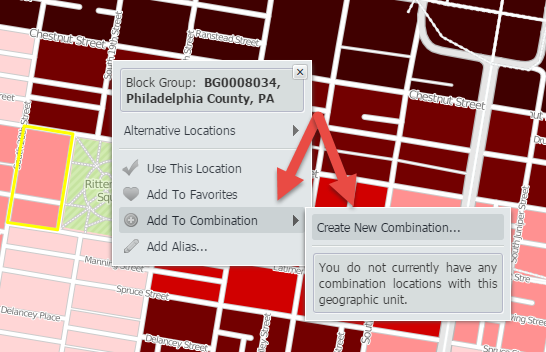
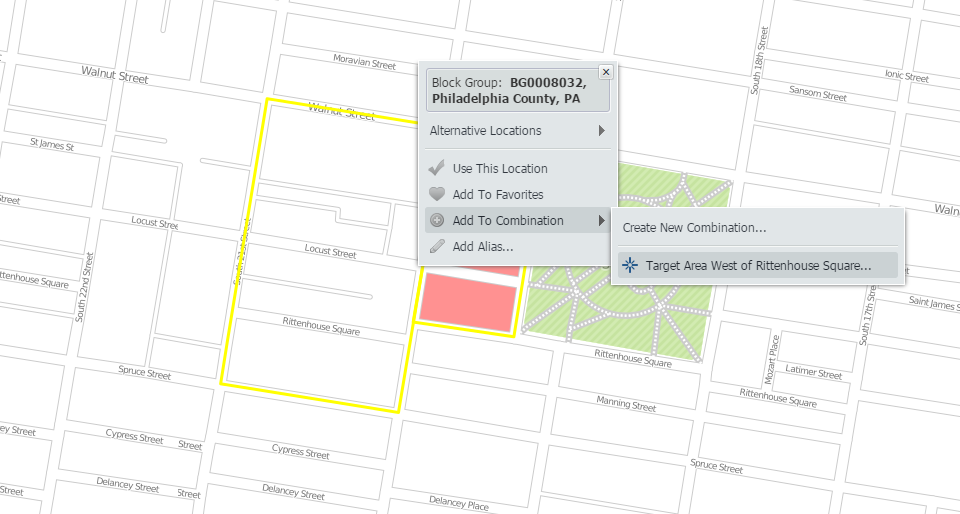
Utilize the i-tool and select the first area that will be included in your custom location. Hover over Add to Combination to select the option Create New Combination.
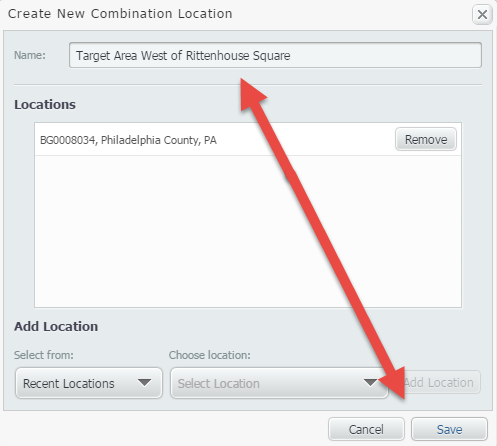
Give your location a name, and click save.
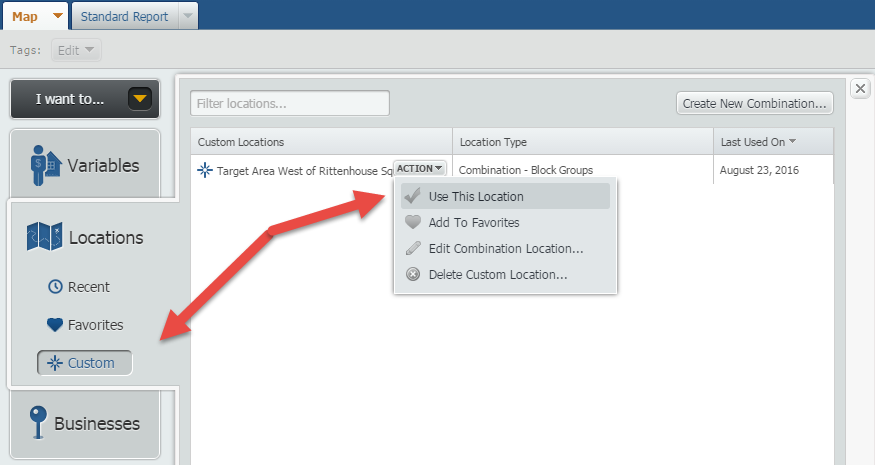
With the Combination now created, open the Locations panel, click on Custom and use the newly created combination.
Your map will now look like this (with the one location we clicked on earlier):
Note: We applied a Location Mask to remove colors outside of our target area (shown in white now).
Use the i-tool once more, and repeat the process above adding new locations into the combination location:
Final result:
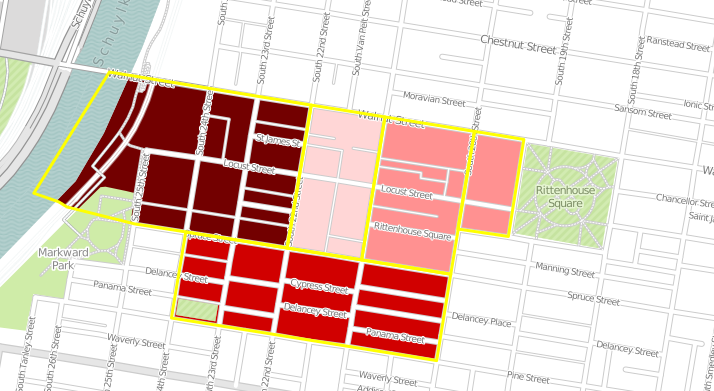
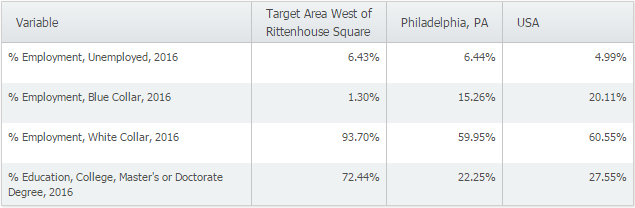
With the target area now created, you can utilize it in both maps and reports for further analysis.
Stay tuned for more SimplyMap tips and how-to’s!
More from SimplyAnalytics
Posted on Jan 07, 2015 by Admin
In this week’s exploration of SimplyMap data, we set out to find which cities in the United States have the highest percentage of older houses. To determine this, we used the variable “% ...
Posted on Sep 15, 2025 by Admin
SimplyAnalytics will be attending the upcoming NCLA Conference in Winston-Salem October 14-17!
Posted on Jan 24, 2009 by Admin
Men's Health magazine took a look this month at where our wireless habits are most out of control. Their methodology includes the use of SimplyMap: First, we crunched data from SimplyMap...
Posted on Feb 13, 2015 by Admin
In this week’s report exploring SimplyMap data, we want to find out where America’s remote workers reside. To find this, we can tap into the Census data in SimplyMap. The specific variabl...
Posted on Jul 09, 2009 by Admin
The American Library Association 2009 Annual Conference will take place in Chicago, IL from July 9- July 15, 2009 at McCormick Place West located at 2301 S. Lake Shore Drive Chicago, IL. ...
Posted on Feb 01, 2009 by Admin
Want to know the top 10 wealthiest ZIP codes in your state? How about the top 25 counties with the most elderly residents? Duke University students can now easily answer these questions a...
Posted on Jun 27, 2009 by Admin
The library faculty at Regent University in Virginia recently spotlighted SimplyMap in their Library Faculty Recommendations blog, highlighting its powerful ability to create professional...
Posted on Sep 10, 2019 by Admin
Hello readers! It’s been a minute since our last tutorial post, but you can expect to see more content on a weekly basis moving forward. “From the Help Desk” is a new feature on the blog ...
Posted on Jul 20, 2020 by Admin
Hello readers! We hope you are doing well and staying safe. Today we are excited to introduce the Simmons NCS crosstabs functionality! This is a feature we’ve been working on for a while,...
Posted on Nov 06, 2019 by Admin
Hello readers! We hope you’re having a wonderful week. Today we feature another entry from our From the Help Desk series. Let’s get started! Question: How do I analyze data for downtown? ...