


Exploring SimplyMap Data: America’s Work from Home Employees
Posted on Feb 13, 2015 by Admin
In this week’s report exploring SimplyMap data, we want to find out where America’s remote workers reside. To find this, we can tap into the Census data in SimplyMap. The specific variable is titled: % Employment, Work at Home, 2014.
To get started ranking geographies, first select New Ranking at the top of the SimplyMap screen. Next, locate the variable by following this path: Census Data » In 2010 Geographies » People and Households » Employment » Travel to Work » Mode.
Lastly, to view this data by state select Locations, and set it to USA.
From the Analyze Data By dropdown, select “States” to rank the USA by all states. The results are shown below:
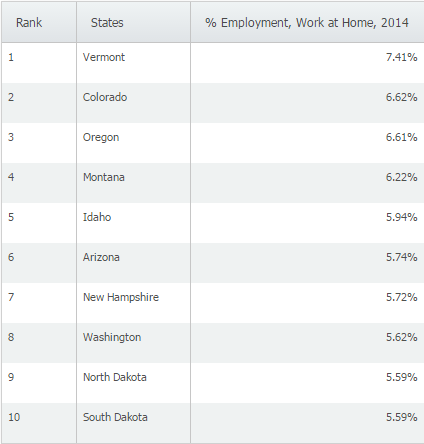
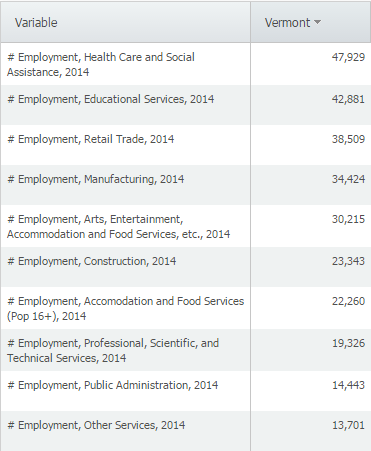
At 7.41%, Vermont ranks first in the US for remote workers. For reference, the national percentage is 4.38. Does anyone have insight as to why Vermont ranks first? A list of the most common employment industries in Vermont is below:
Lastly, we can look at the data by a different geography - change the Analyze Data By dropdown to display Cities. We can also apply a population filter to only show cities with a population greater than 100,000. Here are the results:
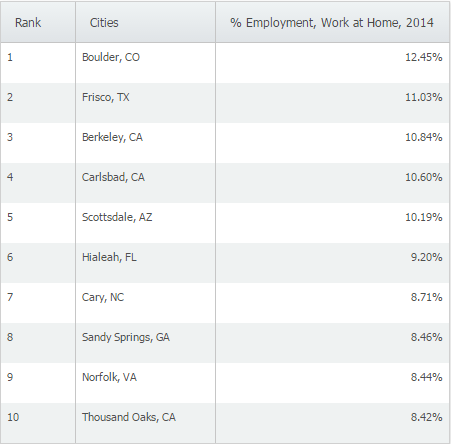
Boulder, CO ranks first in the United States for Work at Home employees. We think this could be attributed to the number of software and tech firms that have opened up or moved to that city in recent years.
We hope you found this SimplyMap report interesting. Stay tuned for more SimplyMap tips and interesting data reports.
Have you already entered for your chance to win an iPad or Kindle Fire? We will be holding the drawing on April 17, 2015. To enter, simply follow us on Twitter and Like Us on Facebook to get your name in consideration.
More from SimplyAnalytics
Posted on Nov 03, 2017 by Admin
This week we’ll talk about one of our favorite features in SimplyAnalytics - the custom combination location. This feature is a simple and effective means to create custom geographies whe...
Posted on Oct 07, 2013 by Admin
Do you know the quickest way to find the name of a Block Group, Census Tract or ZIP code in our upcoming release for 3.0? The i-Tool gives you the ability to click anywhere on a map to g...
Posted on Jul 30, 2008 by Admin
Cornell’s Albert R. Mann Library has subscribed to SimplyMap. They provide some tips and access to the SimplyMap Quick Reference Guide, variable list, and some information on the EASI dat...
Posted on Nov 28, 2023 by Admin
Hello readers! We are happy to announce that SimplyAnalytics has successfully migrated to the Census 2020 boundaries on Sunday, November 19th. This blog will talk about what that is, what...
Posted on Apr 07, 2020 by Admin
As COVID-19 spreads across the United States researchers need access to the latest data visualization and analytics tools. As a result, the SimplyAnalytics team just added COVID-19 data ...
Posted on Nov 11, 2015 by Admin
Inspired by a recent help desk ticket, we wanted to discuss how users may utilize SimplyMap to identify relationships between unique variables. For example, does having a college degree s...
Posted on Feb 02, 2024 by Admin
We are excited to be back exhibiting at PLA this April in Columbus, OH. Join us at Booth #2631 to discover how SimplyAnalytics can help libraries understand their service area, assist sma...
Posted on Mar 30, 2016 by Admin
In previous blog entries we highlighted the usefulness of viewing multiple years of data for the same variable. In short, analyzing the same variable across multiple years allows users to...
Posted on Dec 15, 2014 by Admin
Stop by the Geographic Research booth at the Ontario Library Association Super Conference to check out SimplyMap Canada. The conference will take place January 28-31 at the Metro Toronto ...
Posted on Feb 16, 2009 by Admin
Men's Health conducted their first survey of America's recycling habits, and used SimplyMap in their research. Here’s how the editors explain their methodology: To determine how well citi...