


Using SimplyMap to Identify Relationships Between Variables
Posted on Nov 11, 2015 by Admin
Inspired by a recent help desk ticket, we wanted to discuss how users may utilize SimplyMap to identify relationships between unique variables. For example, does having a college degree significantly impact the median income of areas? And how does median income effect spending on eating out? Let’s take a look at ZIP Codes within the state of North Carolina.
To quickly analyze a larger area by its smaller geographies, a Location Analysis Report is ideal.
Click on New Tabular Report > Location Analysis:

Choose the state of North Carolina, and navigate to the variables you would like to see compared and analyzed. In this example, we’ll use:
Household Inc, Median
% Education, College, Master's or Doctorate Degree, 2015
% Education, High School
Food away from home (Household Average)
# Households (HHs)
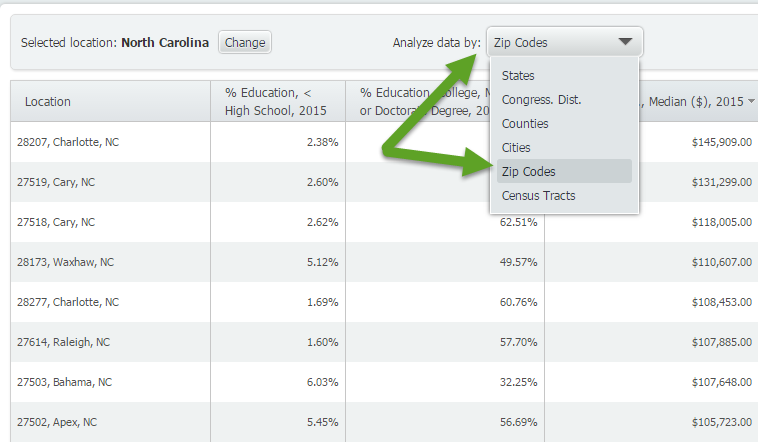
Once you’ve selected your variables, close out the Variables Panel and your report will be created. Be sure to select ZIP Codes from the Analyze Data By option that appears towards the top, shown below.
The last step is to choose a variable (column header) and Sort Descending. For example, if you sort descending for Median HH Income, you will get a ranked list (from high to low) of income by Zip Code. Scan the other columns to get a sense of education levels in these locations, and how much they tend to spend eating out.
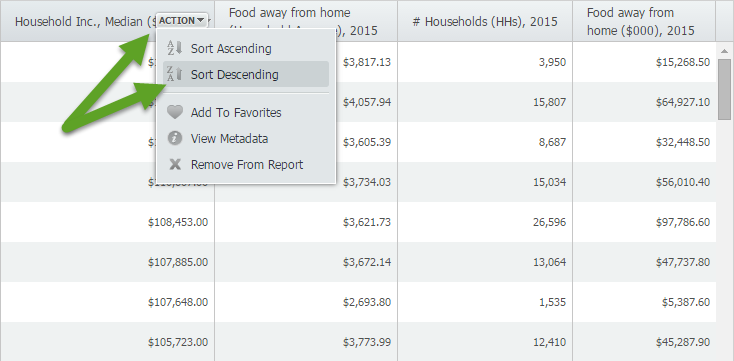
Sort Descending Income Results:
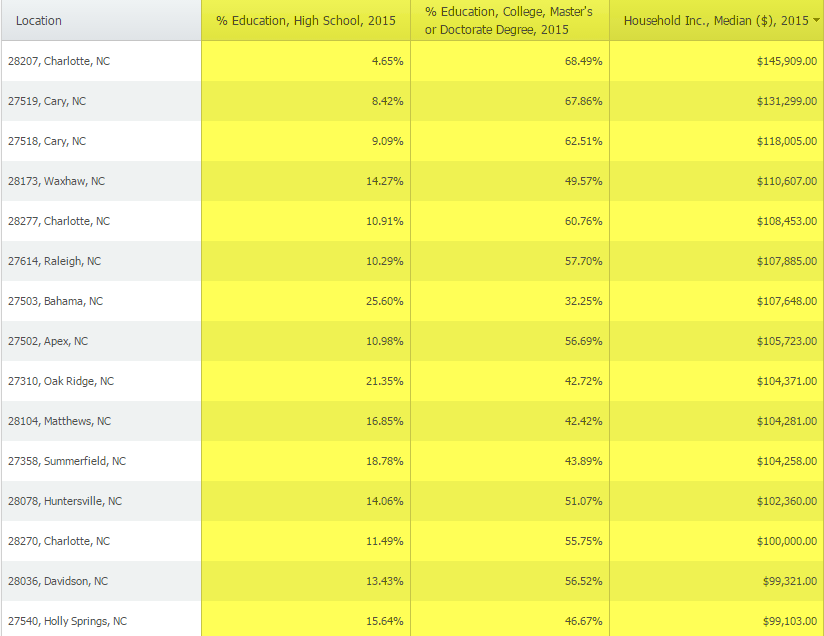
Conclusion: The results yield that higher median income areas tends to also have a higher percentage of residents who have at least a college degree. The money spent eating out was somewhat surprising as results did not vary significantly in lower median income areas (although it did go down and especially in the very low income areas).
Note: You may also want to look at # Households or Population Totals in these areas as the averages and percentages would be impacted by those figures.
These results seem to verify a relationship that’s already well known and somewhat intuitive, however, with more than 60,000 variables in SimplyMap you could study relationships between Median Income and Whiskey Drinking, or Pet Ownership, or Yoga Participation, Transportation to work... the possibilities are endless. We’ll be sure to revisit this same topic in the near future!
More from SimplyAnalytics
Posted on Oct 07, 2024 by Admin
We're headed to Charleston! Come visit the SimplyAnalytics team on November 12th at the Gaillard Center at booth 41. We'll be doing live demonstrations of the database, answering question...
Posted on Jul 30, 2018 by Admin
Hello readers! Welcome to this week’s blog. This week we will feature the Related Data Table view and how you can use it to maximize your productivity in SimplyAnalytics. What is it? The ...
Posted on Oct 27, 2017 by Admin
Welcome to our first ever SimplyAnalytics blog! Every Friday we’ll post a write up on a specific feature or highlight some interesting data in SimplyAnalytics. The goal of these posts is ...
Posted on Nov 11, 2013 by Admin
Chad Boeninger, Business & Economics Subject Specialist at Ohio University Libraries has produced some excellent tutorial videos to help students learn how to analyze data and create ...
Posted on Apr 30, 2024 by Admin
Congratulations to Brandyn Whitaker as the recipient of the 2024 BRASS Student Travel Award! Brandyn is a Library Services Associate in the Workforce and Economic Development department a...
Posted on Oct 08, 2008 by Admin
Geographic Research, Inc. (GRI) is pleased to sponsor the fourth annual American Collegiate Retailing Association’s Undergraduate Student Retail Analysis Competition. This is the second ...
Posted on Sep 07, 2011 by Admin
Geographic Research will be exhibiting and presenting during a vendor showcase session at the upcoming North Carolina Library Association (NCLA) Biennial Conference, October 4-7, 2011 in ...
Posted on Jan 23, 2024 by Admin
We are excited to again make the trip to Los Angeles for SCELCapalooza 2024 hosted at Loyola Marymount University! Please drop by our table on Wednesday, Feb. 28th to learn more about Sim...
Posted on Sep 10, 2010 by Admin
SimplyMap Canada is now available at several Canadian institutions, including York University and Ryerson University, in Toronto. SimplyMap Canada has all of the great features included i...
Posted on Dec 15, 2014 by Admin
Stop by the Geographic Research booth at the Ontario Library Association Super Conference to check out SimplyMap Canada. The conference will take place January 28-31 at the Metro Toronto ...