


SimplyMap Tip - Choosing the Correct Report
Posted on Jan 23, 2015 by Admin
SimplyMap offers a total of 5 unique types of reports: Standard Report, Ranking Report, Business Report, Ring Study, and Location Analysis. This brief write up will define what each report does, and provide a real-world example of each.
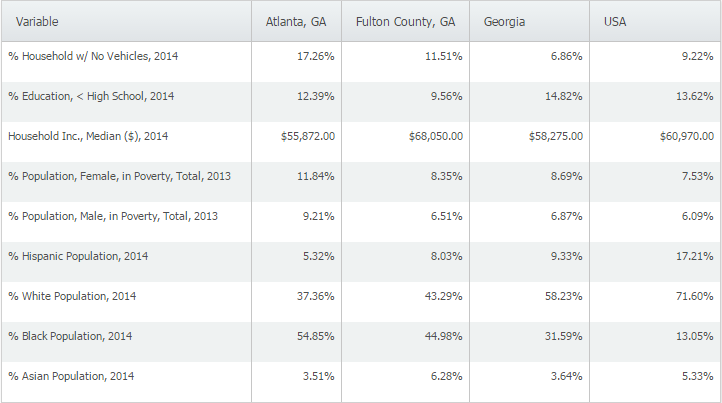
Standard Report definition - a table comparing multiple variables across several locations/location types.
Standard Report real-world use - you are applying for a grant for your city, and would like to analyze some socioeconomic variables to compare your city against the county, state, and United States.
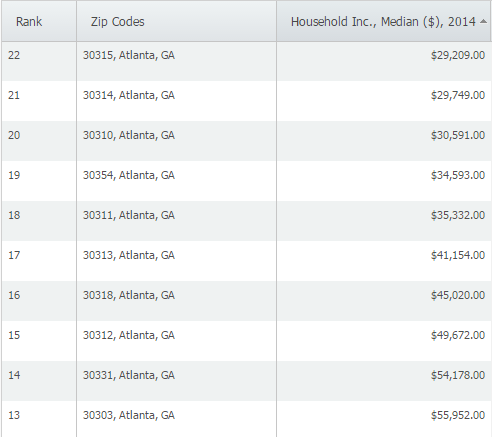
Ranking Report definition - a table ranking up to 250 locations within a single geography (ex. zipcodes within a city) and single data variable.
Ranking Report real-world use - you are looking for a target area to open up a social program for low income areas and want to rank ZIP Codes in Atlanta, GA from lowest median income up.
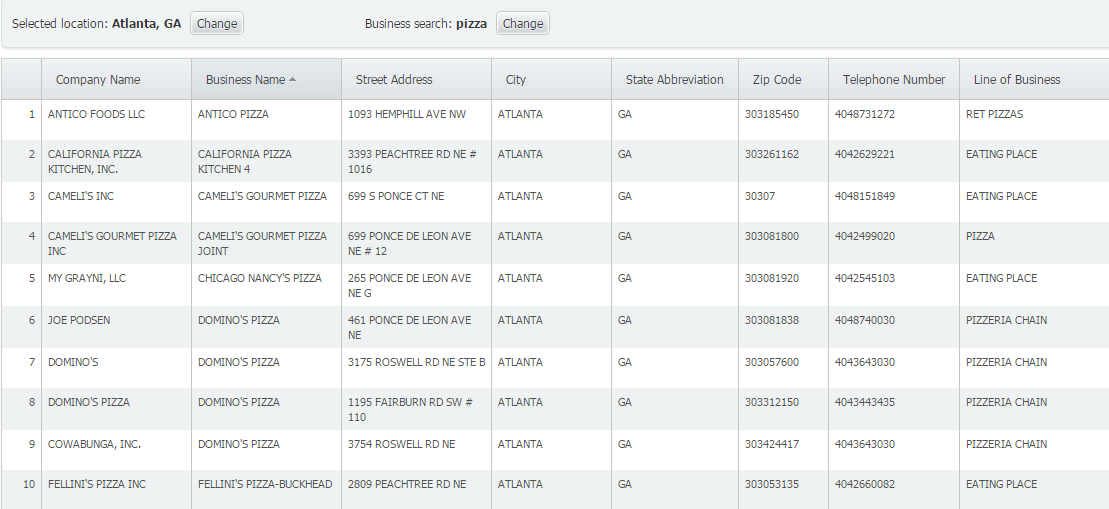
Business Report definition - generates a report showing all businesses that meet your search criteria within a given location.
Business Report real-world use - you are thinking of opening up a pizza restaurant in a city, so you want to see a list of how many pizza restaurants already exist close to your desired location.
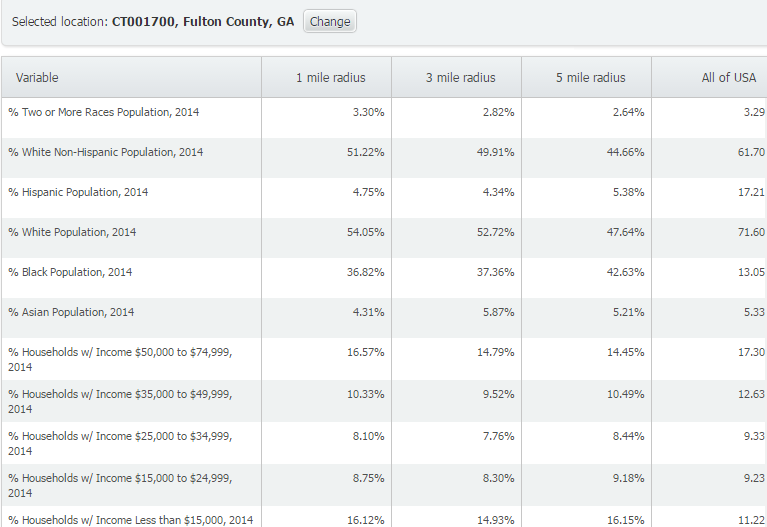
Ring Study definition - a demographic analysis of a target area based on a 1, 3, or 5 mile (or kilometer) radius around a location.
Ring Study real-world use - use to compare different variables in the immediate area, within a specified radius around the selected location.
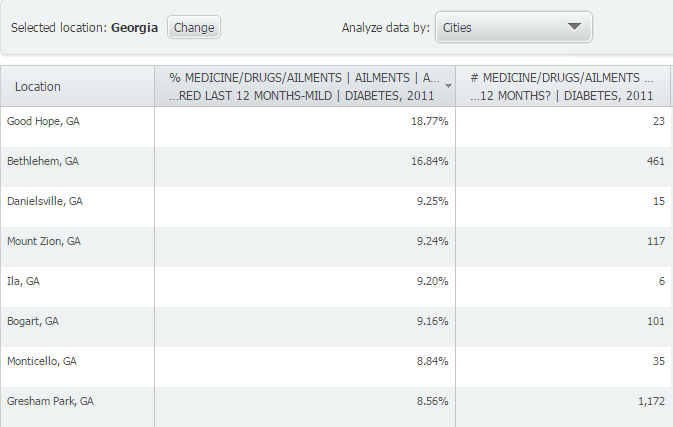
Location Analysis definition - view & compare data for all counties in a state, ZIP codes in a city, census tracts in a county, etc.
Location Analysis real-world use - A medical equipment provider may review health data in a Location Analysis to identify cities in the state to consider visiting to market equipment for an ailment.
Stay tuned for more SimplyMap tips, and don’t forget to follow us on Twitter and like us on Facebook!
More from SimplyAnalytics
Posted on Mar 30, 2016 by Admin
In previous blog entries we highlighted the usefulness of viewing multiple years of data for the same variable. In short, analyzing the same variable across multiple years allows users to...
Posted on Sep 01, 2008 by Admin
The King County Library System in Washington State now subscribes to SimplyMap, and has published a brief review on their blog, Library Talk.
Posted on Sep 27, 2019 by Admin
Hello readers! This week we provide an in-depth response to a question asking about the legend classification methods in SimplyAnalytics. This response is now part of our Help Center: htt...
Posted on May 06, 2016 by Admin
Visit us at booth #775 at the ALA 2016 annual conference to meet the SimplyMap team and learn more about the features and functions behind SimplyMap. Have a Ghirardelli Chocolate while we...
Posted on Jan 27, 2015 by Admin
In this week’s report exploring SimplyMap data, we take a look at where America’s bookworms reside. To find this data, we used the variable, Reading (Household Average), 2014 found in the...
Posted on Dec 12, 2011 by Admin
Men's Health magazine has published a ranked list to help readers find the cities where Americans are the saddest and where they are living with big smiles on their faces. As they note, "...
Posted on Dec 16, 2015 by Admin
Visit the SimplyMap team at the ALA Midwinter Meeting 2016 in Boston. We will be at booth #1913 offering product demonstrations, tips & tricks, and of course Ghirardelli Chocolate! Ex...
Posted on Jan 12, 2020 by Admin
Happy New Year! SimplyAnalytics will be exhibiting at the ALA Midwinter meeting, held this year at the Pennsylvania Convention Center in Philadelphia on January 24th-27th. If you attend, ...
Posted on May 23, 2012 by Admin
We will be exhibiting at the Special Libraries Association (SLA) annual conference and Info-Expo at McCormick Place in Chicago Sunday June 15th - Tuesday July 17th. Visit us at Booth 124 ...