


Exploring SimplyMap Data: America’s Bookworms
Posted on Jan 27, 2015 by Admin
In this week’s report exploring SimplyMap data, we take a look at where America’s bookworms reside. To find this data, we used the variable, Reading (Household Average), 2014 found in the Consumer Expenditure folder. This variable encompasses all expenses used on magazine subscriptions, newspaper subscriptions, and books.
To make this report, we chose to utilize a Ranking Report. First, we took a look at the top 10 states:
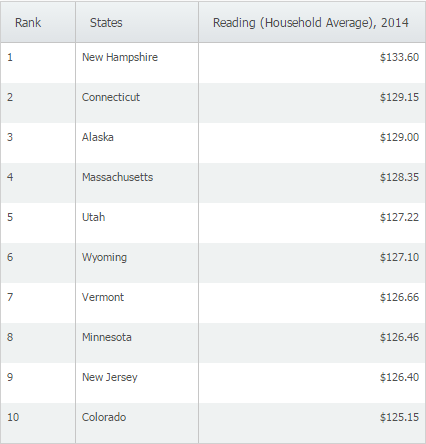
At a yearly household average of $133.60, the state of New Hampshire ranks first in the United States in spending on reading material. For reference, the United States at large totaled $116.85. Next, we applied a data filter to view cities with a population of more than 75,000. The results are as follows:
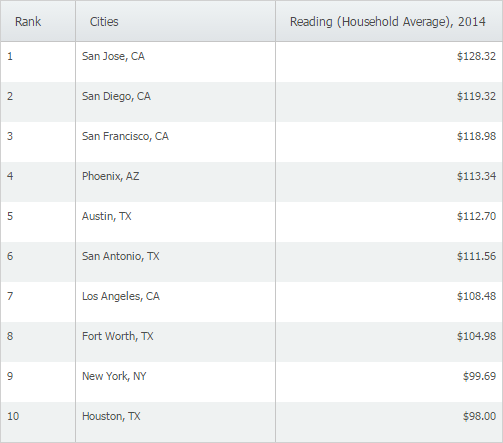
San Jose, CA ranks first in the United States for household spending on reading materials. California is also well represented in the top 10 with San Diego (2), San Francisco (3), and Los Angeles (7) also ranking in the top 10.
Stay tuned for more SimplyMap data reports and tips!
More from SimplyAnalytics
Posted on May 08, 2018 by Admin
We will be exhibiting at the SLA conference in Baltimore, MD this June. Stop by booth #912 and say hello - we look forward to demonstrating SimplyAnalytics, answering your questions, and ...
Posted on Jul 24, 2013 by Admin
Registration is now open for the North Carolina Library Association Conference! Visit us at the 60th biennial conference (Booth #45) through October 15 - 18, 2013. We have beautiful ca...
Posted on May 25, 2010 by Admin
We will be exhibiting at the 2010 SLA Annual Conference & INFO-EXPO June 13-15 at the Ernest N. Morial Convention Center in New Orleans, LA. Join us at booth 1537 - bring your quest...
Posted on Feb 20, 2018 by Admin
We are looking forward to attending the annual SCELC (Statewide California Electronic Library Consortium) Vendor day, at Loyola Marymount University in Los Angeles on March 8th. In additi...
Posted on May 28, 2009 by Admin
The Charleston Advisor, which publishes critical reviews of online resources for libraries, published a review of SimplyMap in April. We are very pleased to have received 4 1/4 stars out...
Posted on Dec 16, 2015 by Admin
Visit the SimplyMap team at the ALA Midwinter Meeting 2016 in Boston. We will be at booth #1913 offering product demonstrations, tips & tricks, and of course Ghirardelli Chocolate! Ex...
Posted on Feb 26, 2014 by Admin
The Statewide California Electronic Library Consortium is holding another packed week of workshops and networking during the SCELCapalooza event in March 2014. Geographic Research will b...
Posted on May 26, 2020 by Admin
Hello readers! We hope you are doing well, and thank you for your continued support of SimplyAnalytics. We are excited to announce that scatterplots are officially live! Scatter plots ar...
Posted on Nov 20, 2015 by Admin
In a previous blog we demonstrated the power of utilizing multiple years for the same variable. We found that the usage of Amazon.com had grown substationally from 2008-2014. In this week...
Posted on Nov 06, 2013 by Admin
SimplyMap includes a number of helpful support tools; guided wizards available when and where you need them, detailed help files, and an online support center with FAQs and searchable kno...