


The Landline Telephone’s Descent
Posted on Mar 30, 2016 by Admin
In previous blog entries we highlighted the usefulness of viewing multiple years of data for the same variable. In short, analyzing the same variable across multiple years allows users to identify trends. For example, in one of the previous blogs we showcased the explosion of tablet ownership over recent years (quadrupling!).For this week’s blog, we’ll see if the data matches our own observations on the rapid decline of landline phones in households. Let’s get started!
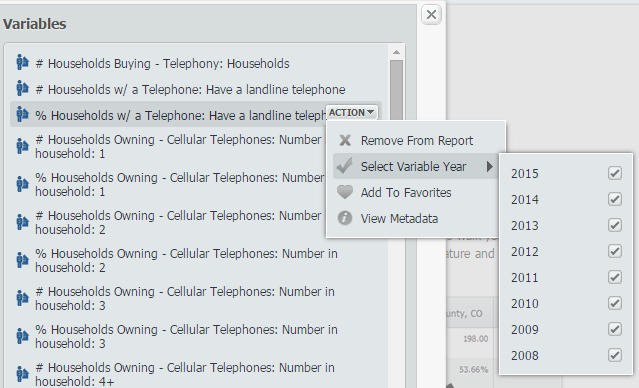
First, open a Standard Report and navigate through this path: MRI Consumer Survey » Telephone to find the variable, % Households w/ a Telephone: Have a landline telephone, 2015.
Hover over the variable and select the Select Variable Year option from the Action Dropdown menu. You will see the years 2008-2015 on your screen. Select each year as shown below:
Close out the variables panel to generate your report for the United States. Here are the results:
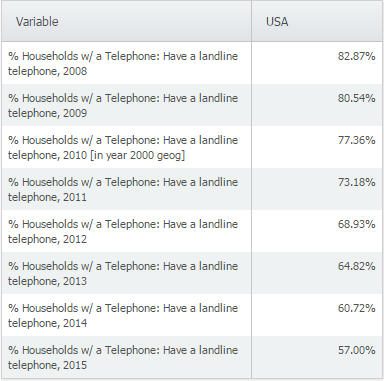
The percentage of households with a landline telephone has dropped significantly, from 82.87% in 2008 to 57% in 2015. We suspect this decrease is due in part to the rise in cell phones among other things, but we’ll leave that data to another blog.
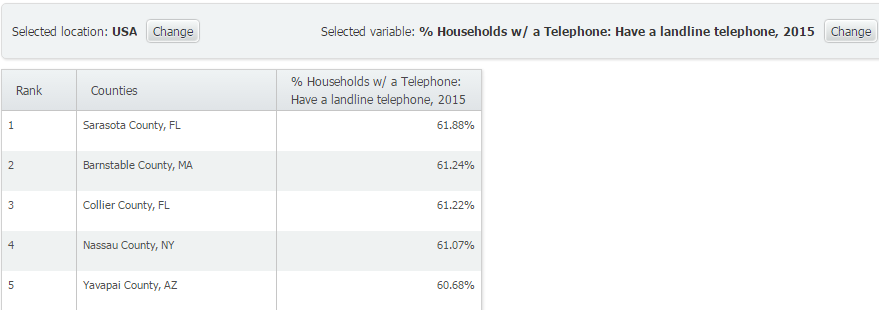
Out of curiosity, we ran a Ranking Report to determine the top 5 counties in America with the highest % of households having a landline telephone:
Note: We applied a population filter of > 200,000.
We hope you enjoyed this week’s SimplyMap report - stay tuned for more!
More from SimplyAnalytics
Posted on Mar 30, 2016 by Admin
In previous blog entries we highlighted the usefulness of viewing multiple years of data for the same variable. In short, analyzing the same variable across multiple years allows users to...
Posted on Oct 24, 2014 by Admin
At times it can be useful to apply filters to the data in SimplyMap as a means of focusing on specific characteristics, or preforming a query. For example, a map showing household income ...
Posted on Nov 06, 2014 by Admin
With over 75,000 variables in SimplyMap, you can find virtually any information you want. This week, we take a look at which U.S. locations spend the most money eating at restaurants or c...
Posted on Jul 20, 2020 by Admin
Hello readers! We hope you are doing well and staying safe. Today we are excited to introduce the Simmons NCS crosstabs functionality! This is a feature we’ve been working on for a while,...
Posted on Dec 08, 2010 by Admin
The GRI team will be attending the American Library Association Midwinter meeting this year at the San Diego Convention Center. Visit us in booth 1055 in the exhibit hall from January 7 -...
Posted on Jun 02, 2017 by Admin
We will be exhibiting at SLA in Phoenix, AZ on June 18th-20th. You can find the SimplyAnalytics team at Booth #905. Stop by and check out our groundbreaking new interface, have a chocolat...
Posted on Aug 15, 2013 by Admin
Anyone who has traveled to Seattle hoping for a sunny day could fairly estimate that it is one of the rainiest states with the highest level of precipitation each year. SimmonsLOCAL varia...
Posted on Nov 11, 2014 by Admin
With Veteran’s Day in the US this week, we thought it would be an ideal time to explore some of the variables in SimplyMap that pertain to veterans. Specifically, we wanted to know which ...
Posted on Jun 09, 2016 by Admin
In this week’s blog, we’ll be featuring our newest data offering, PRIZM® Premier. If your institution currently subscribes to PRIZM data, this new module is available at no additional cos...
Posted on Oct 26, 2018 by Admin
Welcome readers! This week we’ll take a look at how to browse for data by category in SimplyAnalytics. Browsing by Category is the default way of browsing for data in SimplyAnalytics. It ...