


COVID-19 Data is Now Available in SimplyAnalytics
Posted on Apr 07, 2020 by Admin
As COVID-19 spreads across the United States researchers need access to the latest data visualization and analytics tools. As a result, the SimplyAnalytics team just added COVID-19 data at the national, state, and county levels to SimplyAnalytics. The data is from USAFacts.org and we update it daily with the latest numbers.
The following data variables are now available in SimplyAnalytics:
- Confirmed COVID-19 Cases by date
- Prevalence of confirmed COVID-19 cases (per 100,000 individuals) by date
- Deaths from COVID-19 by date
- Prevalence of deaths from COVID-19 (per 100,000 individuals) by date
You can find the COVID-19 data in SimplyAnalytics in two places:
- [recommended] Go to the Data tab, click on the "Data Folder" view (located just below the data search box), then scroll to the bottom of the list of data folders, or
- Go to the Data tab, click on the Health category icon, then check the box next to COVID-19 in the list of health sub-categories
This data can be combined with our demographic and health data variables to identify areas with vulnerable residents, such as the elderly, people with respiratory illnesses, and smokers.
Here are the best ways to view this data in SimplyAnalytics:
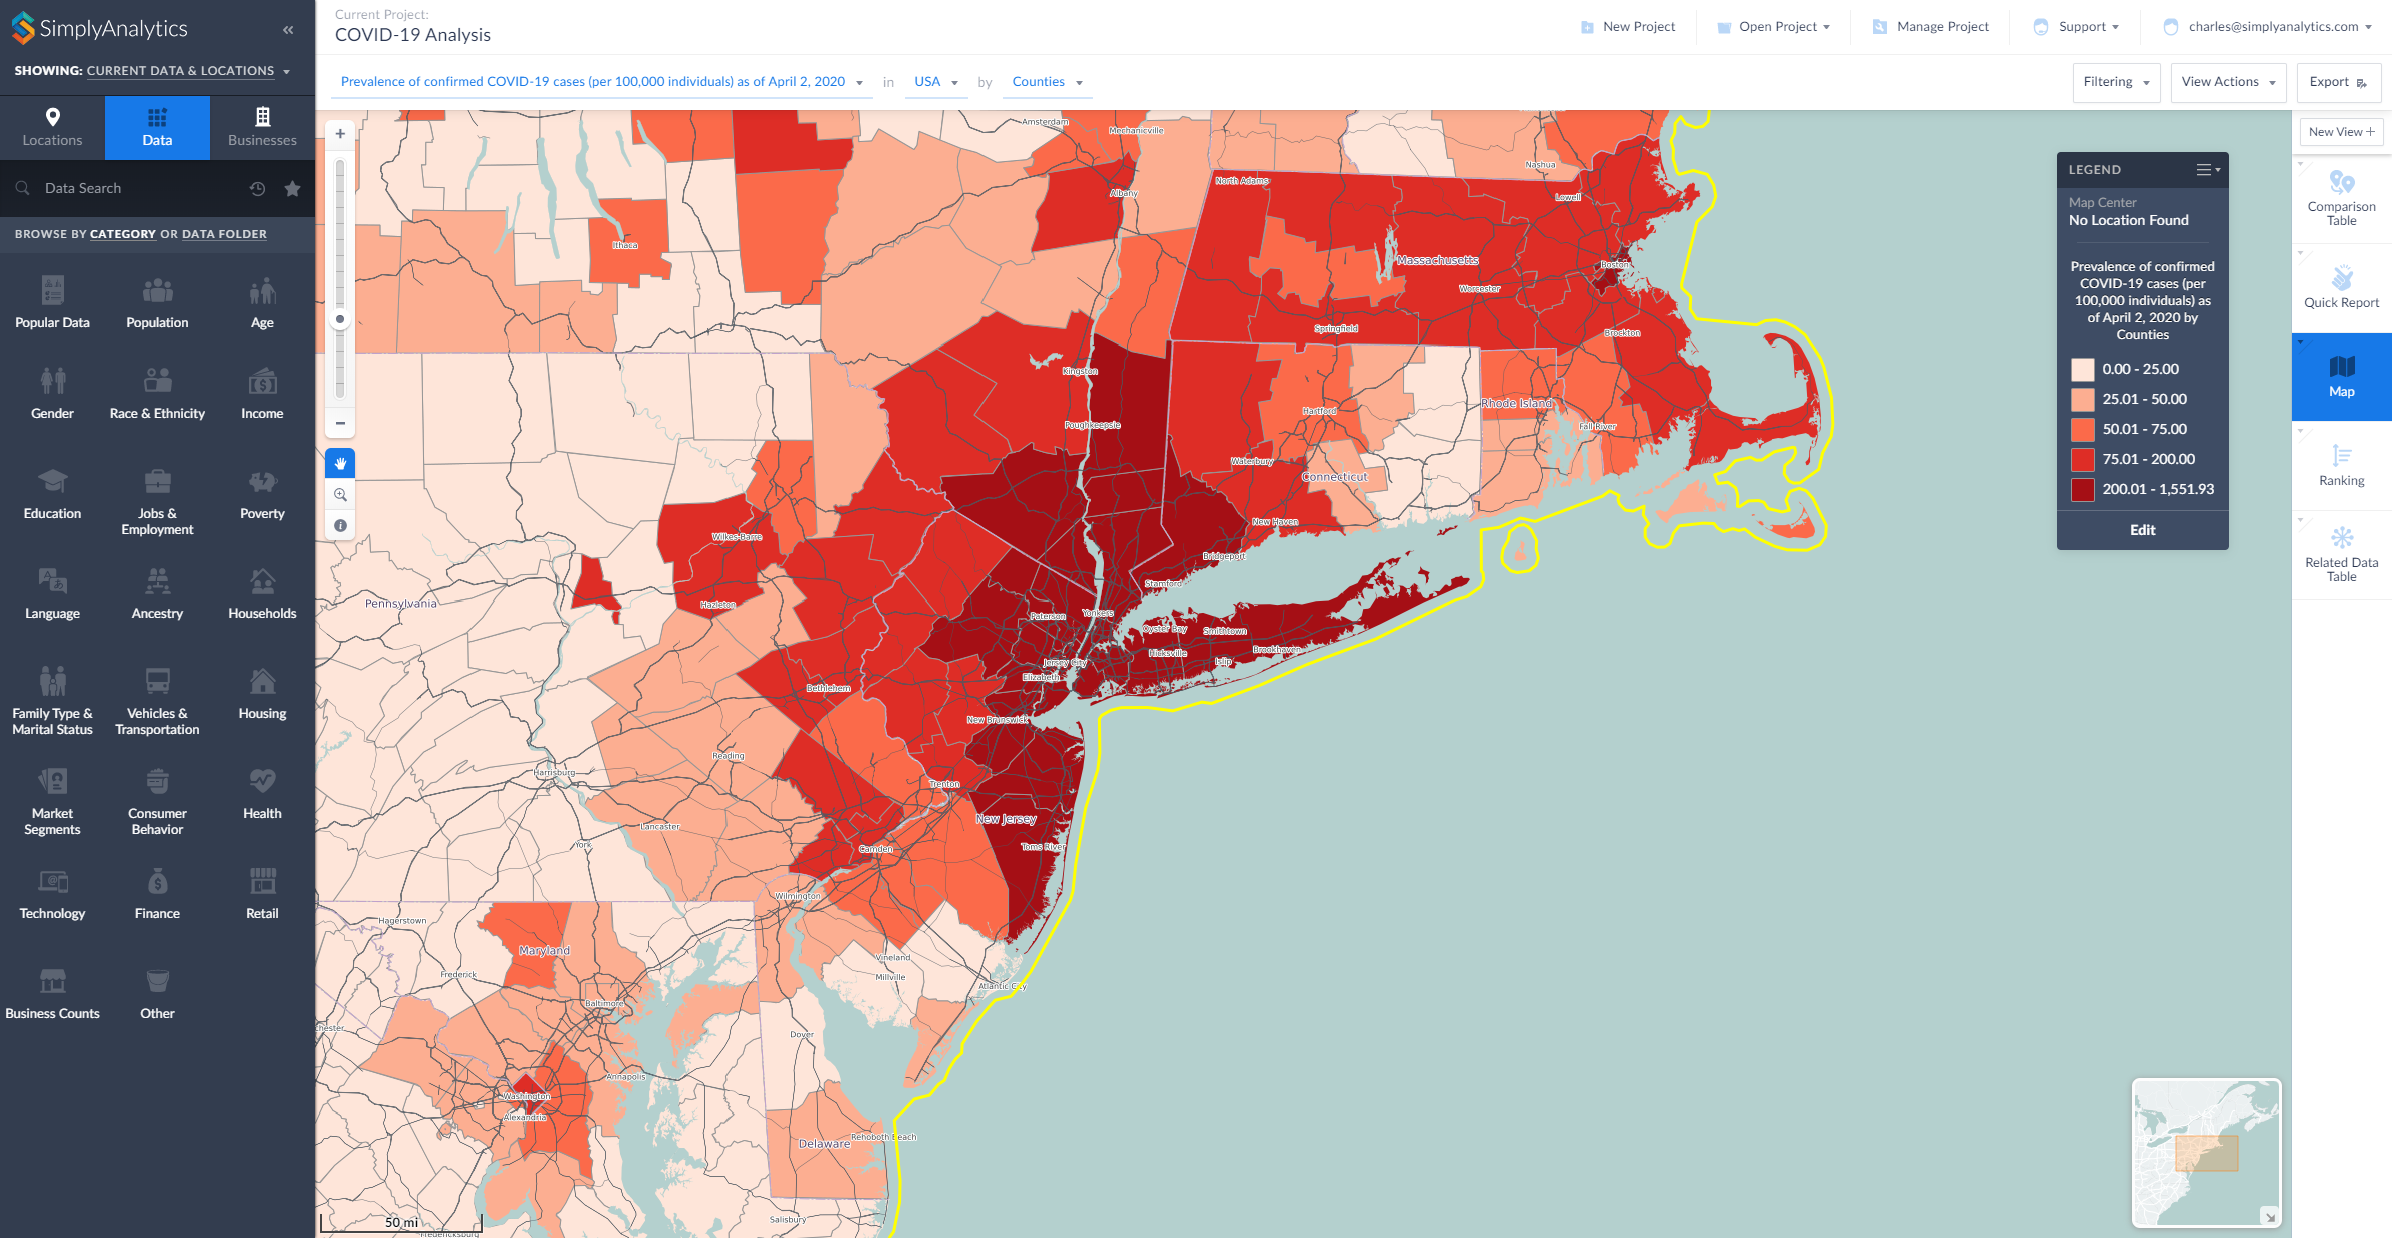
- Map View: map the COVID-19 data by County or State
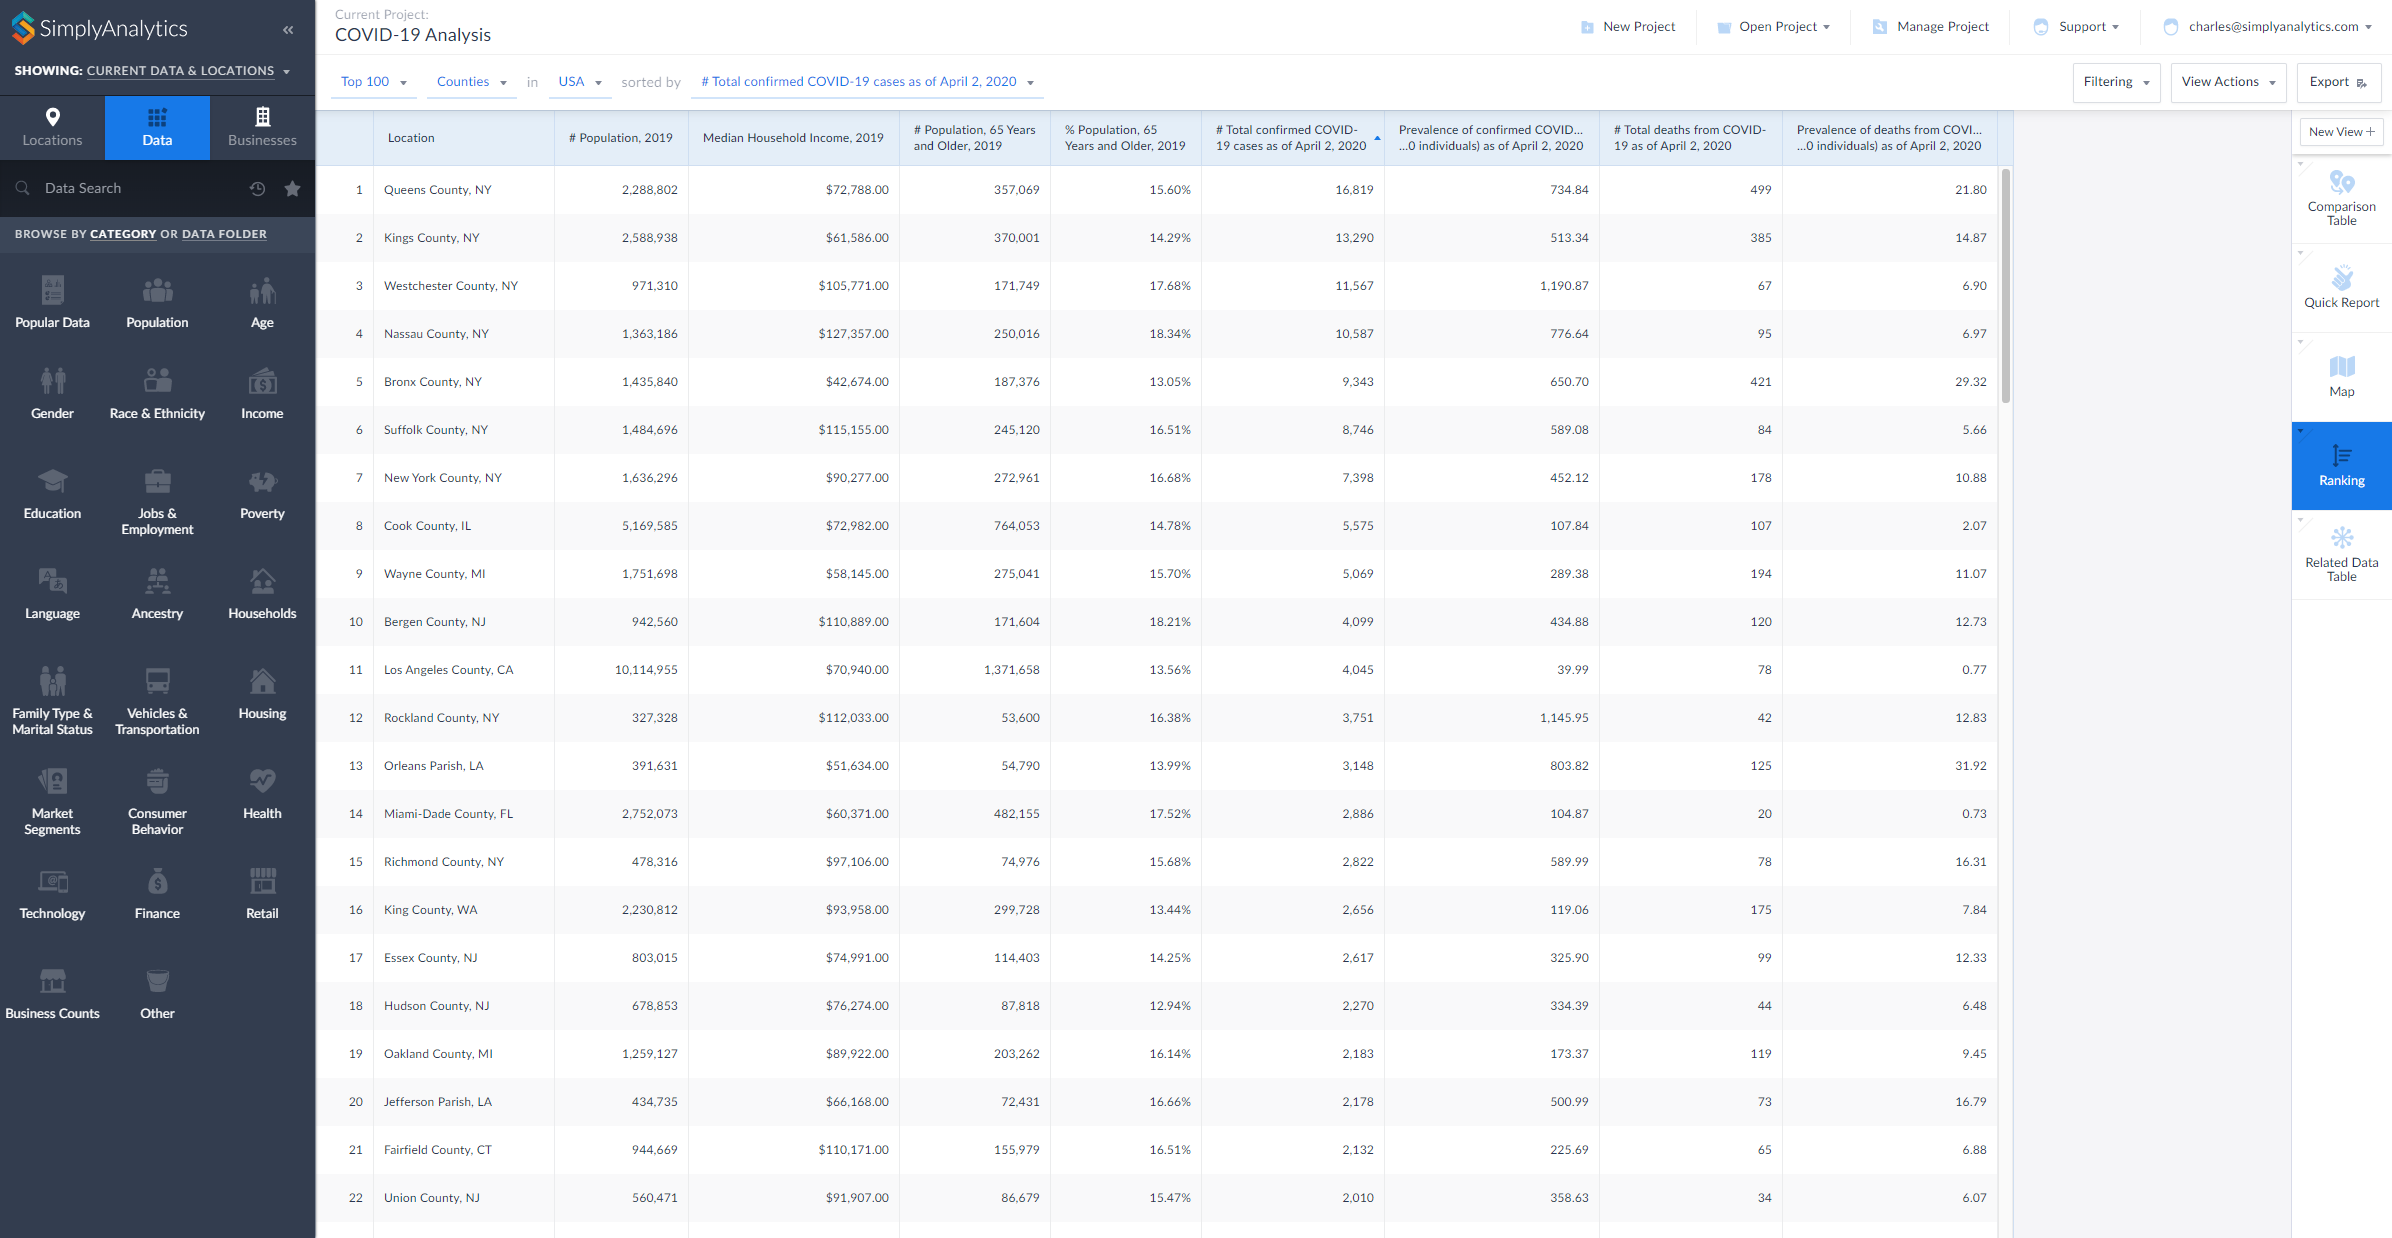
- Ranking View: rank all counties in the United States to identify areas with the highest counts or rates of COVID-19
- Comparison Table View: add your counties and states and any COVID-19 variables to this report to compare rates over time
- Related Data Table View: add one variable from a folder to this view and all of the rest will be added automatically
Here are two examples showing the data being used in SimplyAnalytics, a map and a ranking (click to enlarge):
During this difficult time we are committed to providing remote access and high quality customer support to all of our users who are now working remotely. Please contact us at support@simplyanalytics.com if you have any questions.
More from SimplyAnalytics
Posted on Feb 05, 2015 by Admin
In this week’s edition of exploring SimplyMap data, we take a look at America’s coffee drinkers. SimplyMap contains more than 100 coffee related variables, including consumer spending on ...
Posted on Jul 19, 2016 by Admin
Are you a tech wizard? Maybe you’re an apprentice? Learn more about technology consumption behaviors using the Simmons MOSAIC Technology Adoption segments located within the SimmonsLOCAL ...
Posted on Apr 18, 2017 by Admin
We look forward to attending the Texas Library Association Conference this week in San Antonio and visiting with the library community. Stop by our new SimplyAnalytics booth (2029) and ta...
Posted on Oct 24, 2019 by Admin
Hi everybody! This week we wanted to bring you something unique, so we’re taking you behind the scenes to show you what goes in to setting up the SimplyAnalytics conference booth you’ve c...
Posted on Aug 15, 2013 by Admin
Anyone who has traveled to Seattle hoping for a sunny day could fairly estimate that it is one of the rainiest states with the highest level of precipitation each year. SimmonsLOCAL varia...
Posted on Sep 15, 2016 by Admin
While creating a radius location is the fastest and easiest method for creating a custom location, there may be situations that require a more specific and targeted locale. Let’s say for ...
Posted on May 25, 2010 by Admin
We will be exhibiting at the 2010 SLA Annual Conference & INFO-EXPO June 13-15 at the Ernest N. Morial Convention Center in New Orleans, LA. Join us at booth 1537 - bring your quest...
Posted on May 06, 2013 by Admin
The GRI team is looking forward to exhibiting at SLA 2013 at the San Diego Convention Center, June 9th through the 11th. The Special Libraries Association (SLA) is a nonprofit global orga...
Posted on May 10, 2016 by Admin
One benefit of data and applications like SimplyMap is the ability to visualize information. In this week’s report, we’ll take a quick look at some branding preferences in contiguous Amer...