Exploring SimplyMap Data: Possible Days of Rain
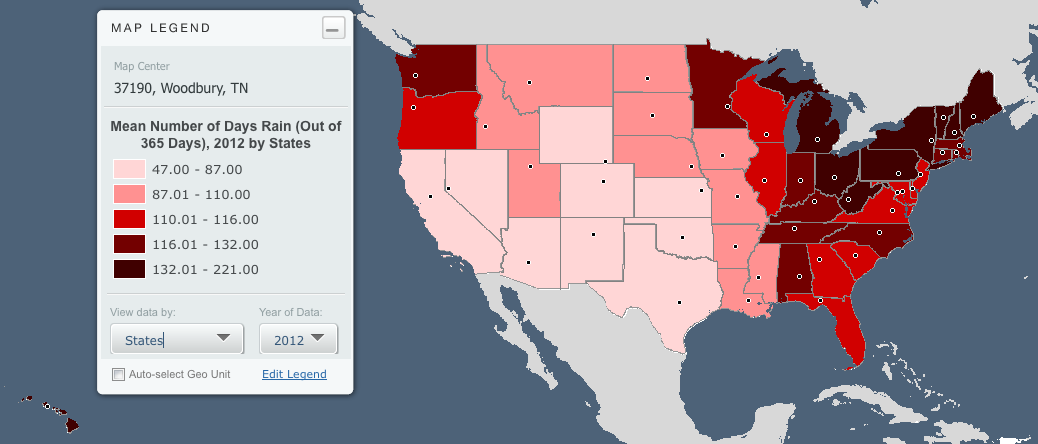
Anyone who has traveled to Seattle hoping for a sunny day could fairly estimate that it is one of the rainiest states with the highest level of precipitation each year. SimmonsLOCAL variables in SimplyMap include Annual Precipitation data by year, but we can also look at frequency by days of the year. The particular data point shown here represents mean number of days where rain was present out of 365 days, rather than total inches of rain annually.
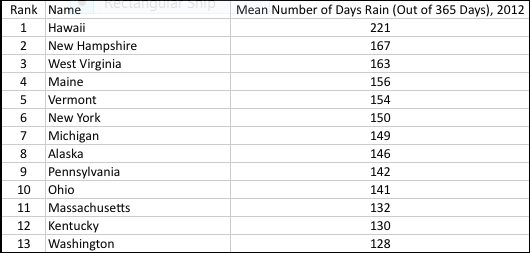
When we first ran this map, we initially overlooked the small state of Hawaii. It wasn’t until we ran a ranking report that we realized it topped the list.
Creating a ranking report with the SimmonsLOCAL “Mean Number Days of Rain” variable, we found that in 2012, there were 221 days of rain in Hawaii compared to Washington with only 128.
To further understand where the rain falls in Hawaii on a map level, we zoomed in for more exact detail by ZIP code.
The ability to quickly toggle between various maps, rankings and reports is helpful for digesting and analyzing the data. Viewing the data in various formats helps the researcher catch nuances in the data and ensure important details are not missed.
More from SimplyAnalytics
Posted on Dec 06, 2009 by Admin
ALA's Choice Magazine, publisher of independent reviews of products and services for academic libraries, released a new review of SimplyMap in the December 2009 edition. The reviewer, Car...
Posted on Oct 16, 2015 by Admin
Did you know that SimplyMap includes the ability to export Shapefile data for use in desktop mapping software (such as MapInfo or ArcGIS)? This advanced feature extends the power of Simpl...
Posted on Jul 30, 2015 by Admin
One great feature within SimplyMap is the ability to track the same variable across multiple years. In this report, we will track the percentage of households in the US ordering items fro...
Posted on Feb 27, 2009 by Admin
Geographic Research, Inc. is pleased to participate in the Statewide California Electronic Library Consortium's (SCELC) 12th Annual Vendor Day. SCELC members and librarians from other aca...
Posted on Sep 20, 2011 by Admin
Men's Health magazine has once again published rankings that include research from SimplyMap. They ranked the most (and least) educated cities in America. In addition to several other sou...
Posted on Apr 17, 2018 by Admin
The SimplyAnalytics team would like to congratulate Rachel Holder, MLS candidate at Indiana University for being selected as this year's recipient of the BRASS Student Travel Award! ...
Posted on Feb 24, 2019 by Admin
We will be exhibiting at SCELC* Vendor Day on March 14th. Visit us at table 510 and attend one of our two sessions demonstrating SimplyAnalytics. The presentations will highlight newly av...
Posted on May 17, 2016 by Admin
This week’s SimplyMap report is a quick reader challenge. Can you guess what the map of the United States below is depicting? Keep in mind the legend colors - lighter is less, and darker ...
Posted on Jul 09, 2009 by Admin
The American Library Association 2009 Annual Conference will take place in Chicago, IL from July 9- July 15, 2009 at McCormick Place West located at 2301 S. Lake Shore Drive Chicago, IL. ...
Posted on Mar 09, 2010 by Admin
The GRI team will be exhibiting at the 2010 Public Library Association conference later this month at the Oregon Convention Center in Portland, OR. The PLA National Conference is the prem...
 Go up
Go up


