 Go up
Go up


Behind the Scenes: Setting up the SimplyAnalytics Booth
Posted on Oct 24, 2019 by Admin
Hi everybody! This week we wanted to bring you something unique, so we’re taking you behind the scenes to show you what goes in to setting up the SimplyAnalytics conference booth you’ve come to know and enjoy for the past few years. Let’s get into it now!
First, we need to ensure that our booth arrived intact during shipping - did you know that altogether, our booth weighs over 450 pounds?! The two pictures below represent our typical initial inspection to make sure everything arrived ok.
The assembly process requires about 3 hours, ideally with 2 people.
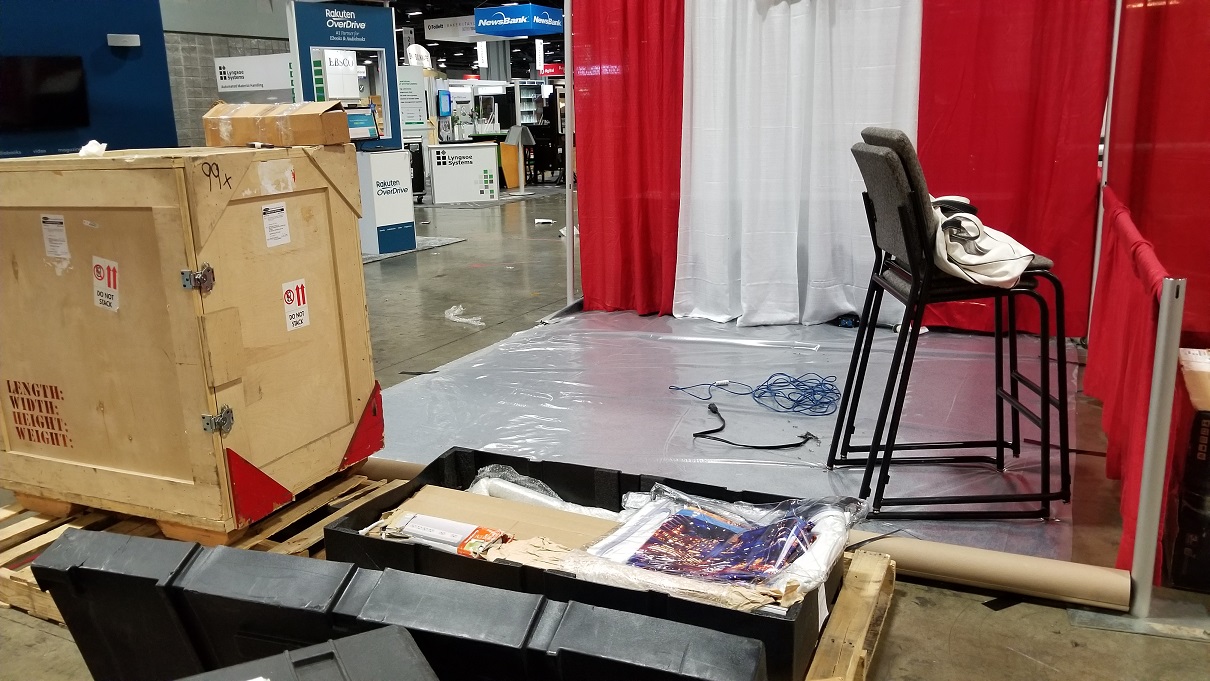
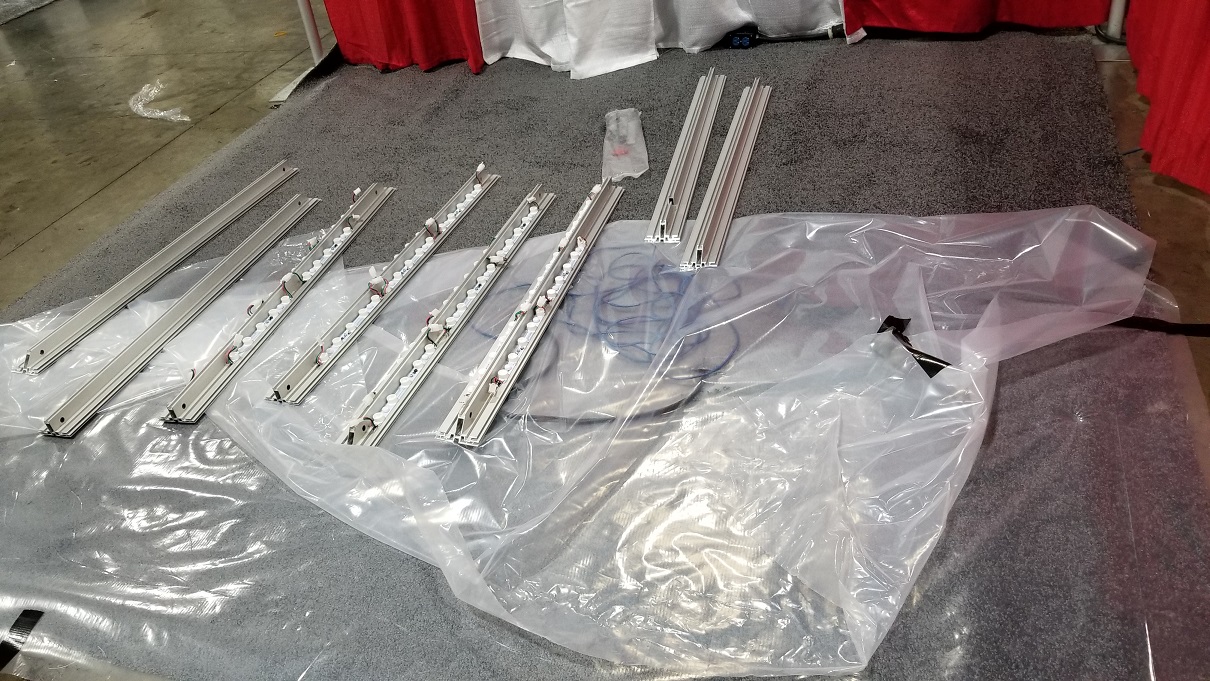
Time to put the frame together! Don’t be fooled by its simple look - this frame not only contains over 20 LED strips that need to be carefully attached (both at the top and bottom ensuring the male/female connectors line up to where our power is located), but connecting the pieces of frame together requires a delicate touch coupled with the right set of fasteners and tools.
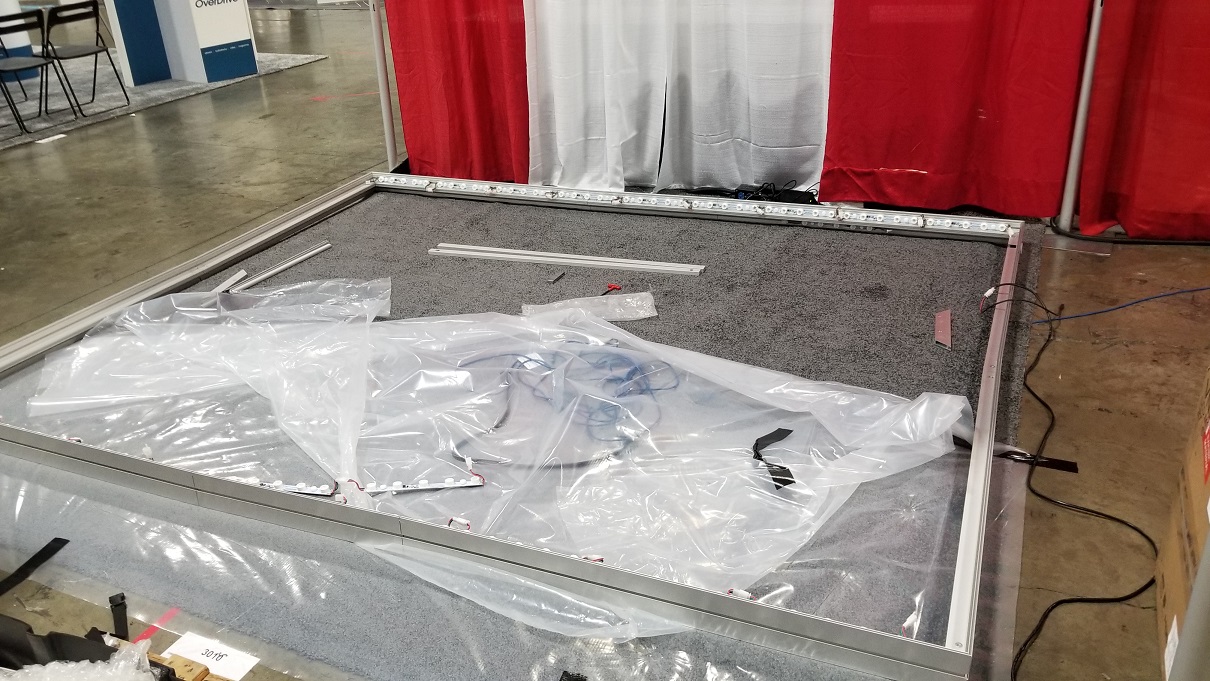
It’s a game of patience and meticulousness and definitely the most time consuming step in setting up our booth. With the frame together, it’s time to put the front and back graphics on.
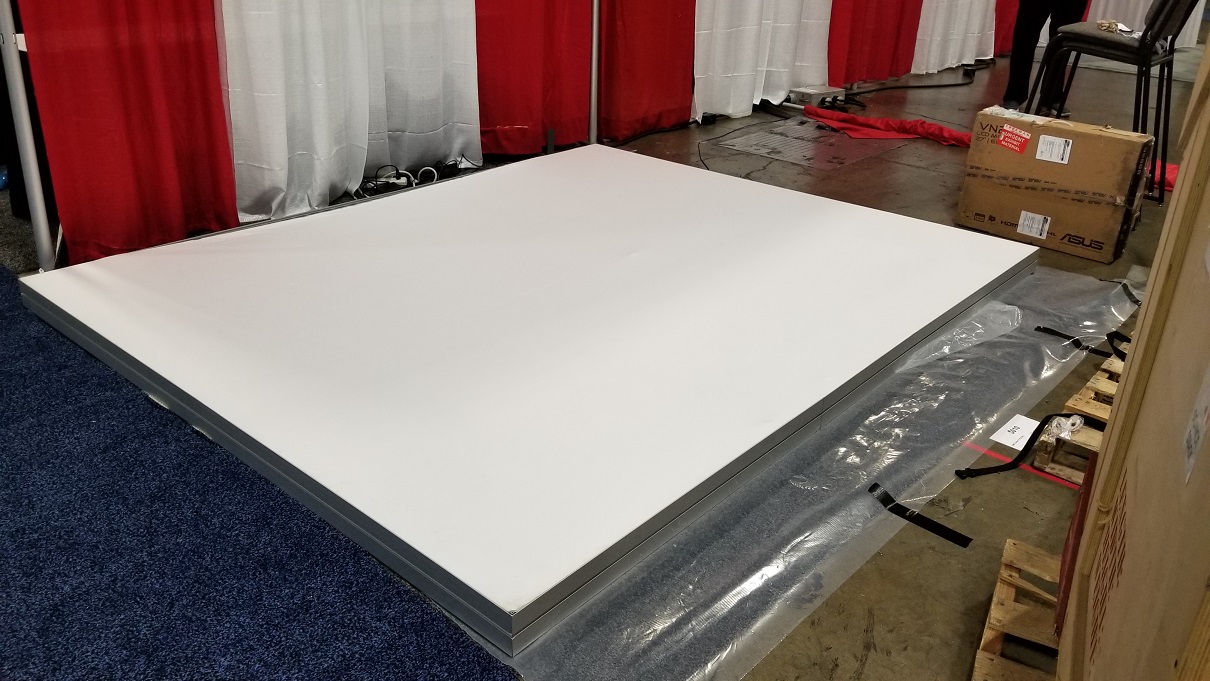
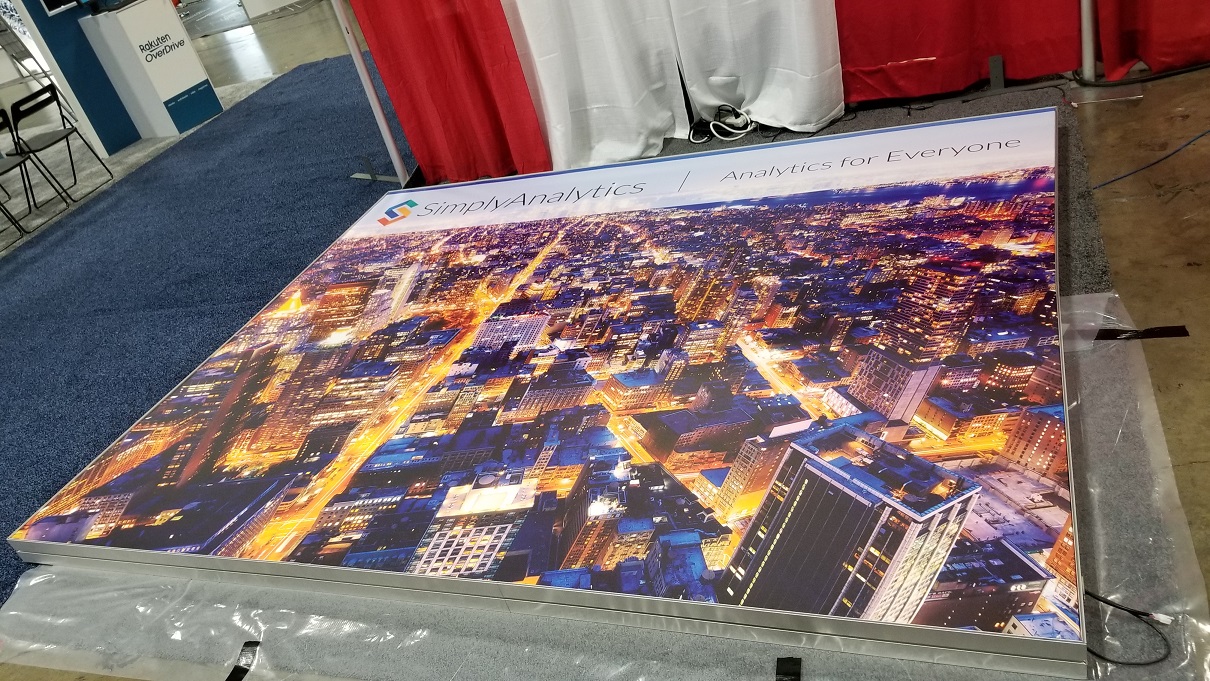
The graphics themselves are large enough to comfortably attach around the frame, however, in order for the booth to look as nice as possible, we have to double over the fabric in a way that stretches the graphics out taut so no wrinkles or creases are visible.
Trust us, it’s harder than it looks! Think of trying to put on a really large fitted sheet, except this requires extra muscle and restraint.
With the tricky parts out of the way, we can proceed to the easier stuff:
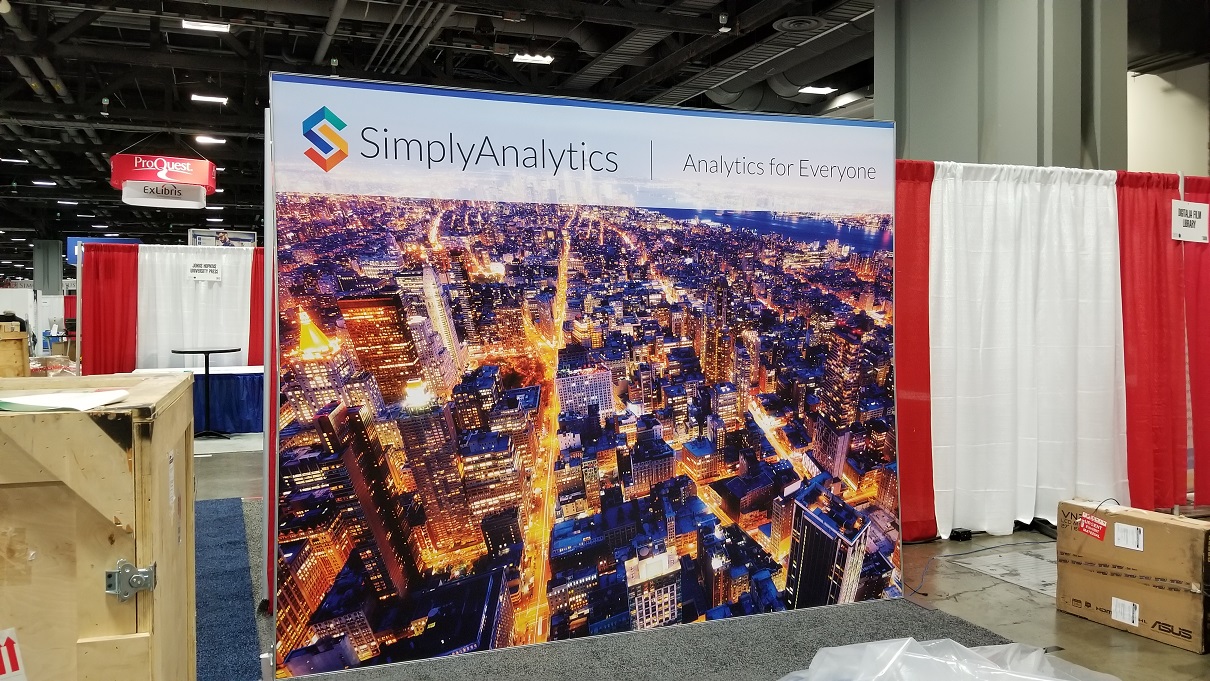
After carefully attaching the legs while still on the floor - it’s time to stand the booth up.
This step is simple, although it often requires that we readjust the leg length on one or both sides to accommodate any differences in the carpet height.
Next, we carefully remove our custom made island stand, and snake through the internet and power cables. The monitor then gets attached, and we are in the home stretch! The brochure stand and chairs can now make an appearance.
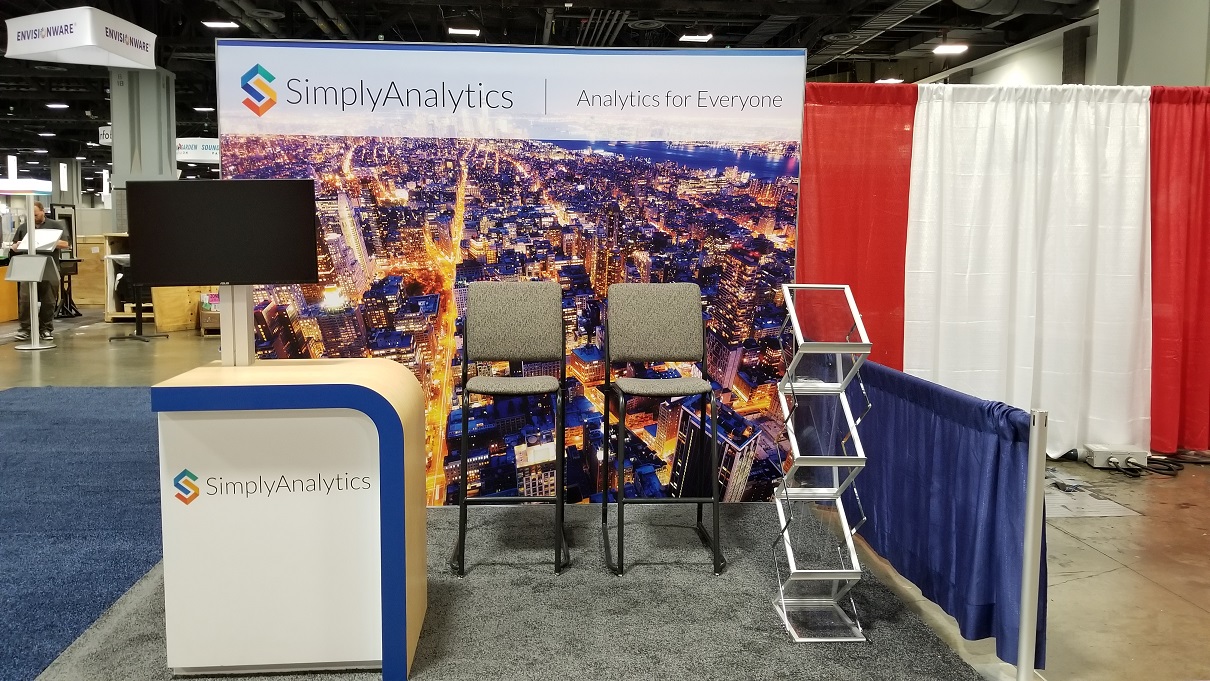
And voila! We bring out our business cards, brochures, Ghirardelli chocolates, laptop and turn everything on to ensure the booth is ready to go for the show.
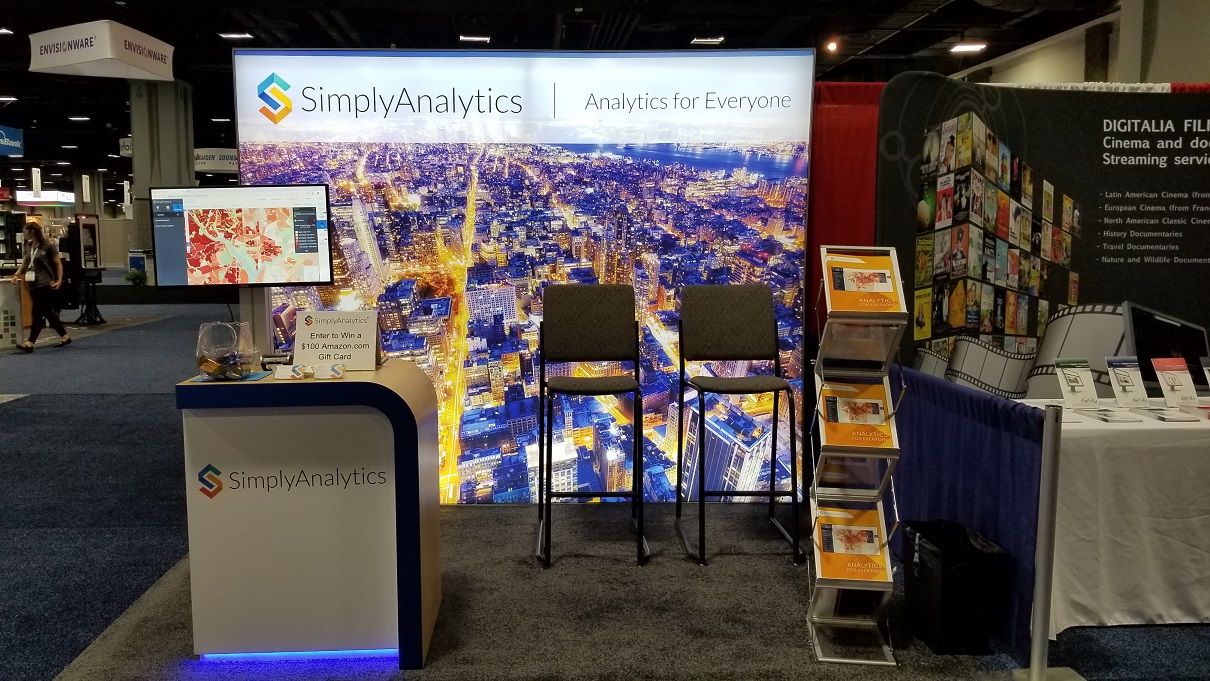
The very last step is typically a high five and “good job!” between colleagues for a job well done.
Did you enjoy this behind the scenes look? Let us know below!
More from SimplyAnalytics


Posted on May 17, 2016 by Admin
This week’s SimplyMap report is a quick reader challenge. Can you guess what the map of the United States below is depicting? Keep in mind the legend colors - lighter is less, and darker ...
Posted on Aug 13, 2015 by Admin
In this quick SimplyMap report, we use Census data to help us identify which city in the United States has the highest percentage of residents who reported walking to work as their mode o...
Posted on Jan 15, 2013 by Admin
The GRI team is looking forward to exhibiting at ACRL 2013 at the Indiana Convention Center in Indianapolis April 10 - 12, 2013. Every other year, ACRL offers its premier professional dev...
Posted on Nov 20, 2015 by Admin
In a previous blog we demonstrated the power of utilizing multiple years for the same variable. We found that the usage of Amazon.com had grown substationally from 2008-2014. In this week...
Posted on Jul 30, 2008 by Admin
Cornell’s Albert R. Mann Library has subscribed to SimplyMap. They provide some tips and access to the SimplyMap Quick Reference Guide, variable list, and some information on the EASI dat...
Posted on May 06, 2013 by Admin
The GRI team is looking forward to exhibiting at SLA 2013 at the San Diego Convention Center, June 9th through the 11th. The Special Libraries Association (SLA) is a nonprofit global orga...
Posted on Sep 28, 2018 by Admin
Welcome readers! Today we have a quick feature highlight that will assist you in browsing and searching for data variables. All data variables have a path where they reside within their d...
Posted on Jan 27, 2015 by Admin
In this week’s report exploring SimplyMap data, we take a look at where America’s bookworms reside. To find this data, we used the variable, Reading (Household Average), 2014 found in the...
Posted on Sep 14, 2021 by Admin
Welcome readers! Today we are excited to welcome histograms to SimplyAnalytics. We hope you enjoy this wonderful new visualization as much as we do. Let’s take a look. What is a histogram...
Posted on May 17, 2012 by Admin
We will be exhibiting at the American Library Association (ALA) Conference in Anaheim Friday June 22nd - Monday June 25th. Visit us at Booth 421 to learn more about SimplyMap and enter ou...