


View Spotlight: Related Data Table
Posted on Jul 30, 2018 by Admin
Hello readers! Welcome to this week’s blog. This week we will feature the Related Data Table view and how you can use it to maximize your productivity in SimplyAnalytics.
What is it?
The Related Data Table View is designed to allow you to quickly add in many similar data variables at once. For example, if you add "% Households w/ Income $50,000 to $74,999" the report will also show all of the other income ranges as well.
Some other use cases: you want to quickly add in all life-stage data variables, or PRIZM psychographic segments, or all Language variables.
Example
Identify what the top PRIZM household segment is for a ZIP Code. The PRIZM Dataset is a marketing segmentation system that allows you to understand the demographic and lifestyle/consumer traits of any location in the United States. This data is very popular within marketing departments across many large companies, and we are happy to offer it as an add on module to your subscription.
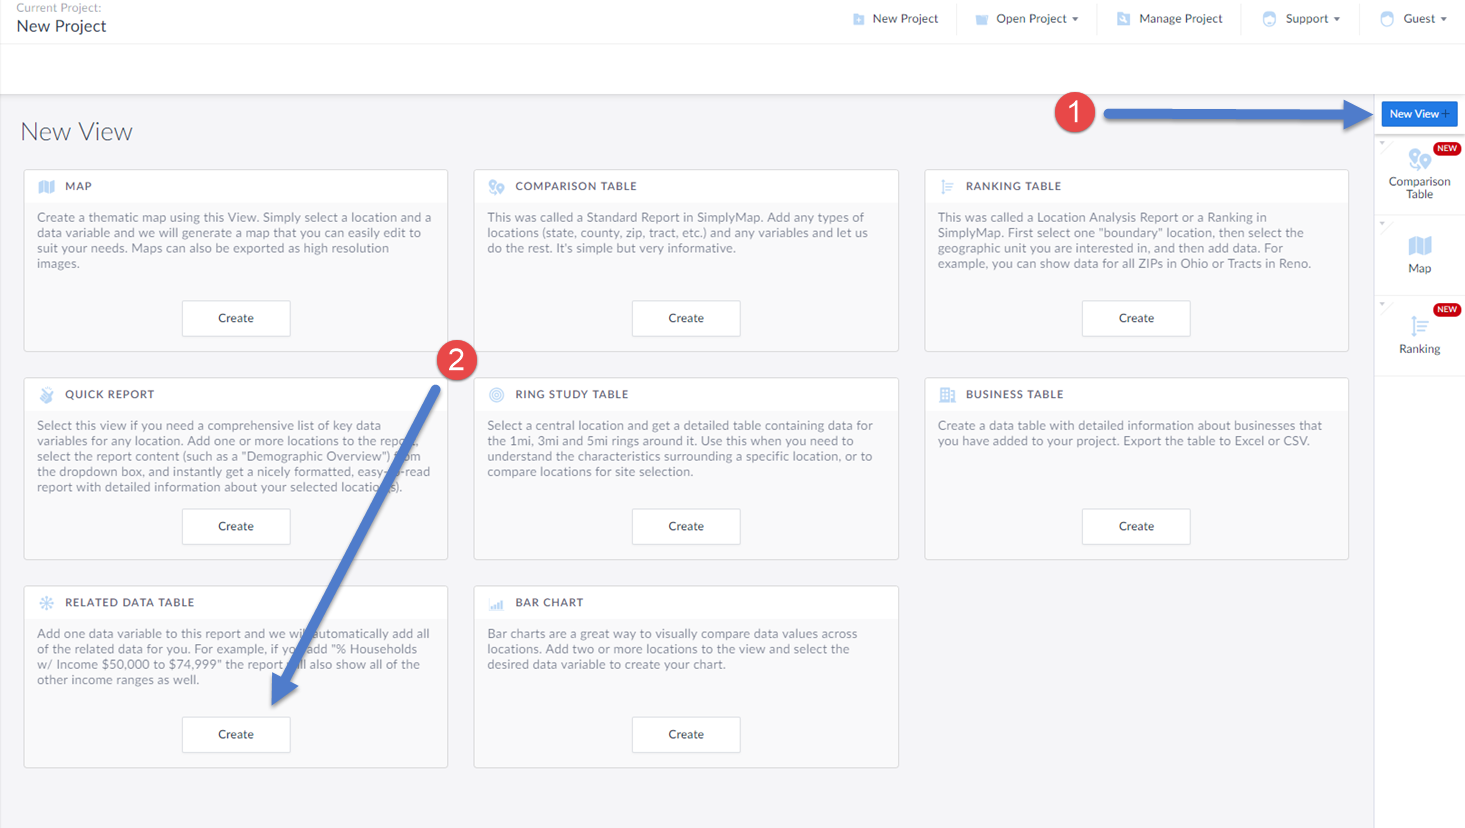
(1) Select New View from the top-right of the interface
(2) Click on the Create button under the Related Data Table section
This will open up the Edit Related Data Table screen. This is where you add in your location, and data variable. In this example, we will select a random PRIZM Premier segment. Keep in mind, this report will add in all of the segments for you.
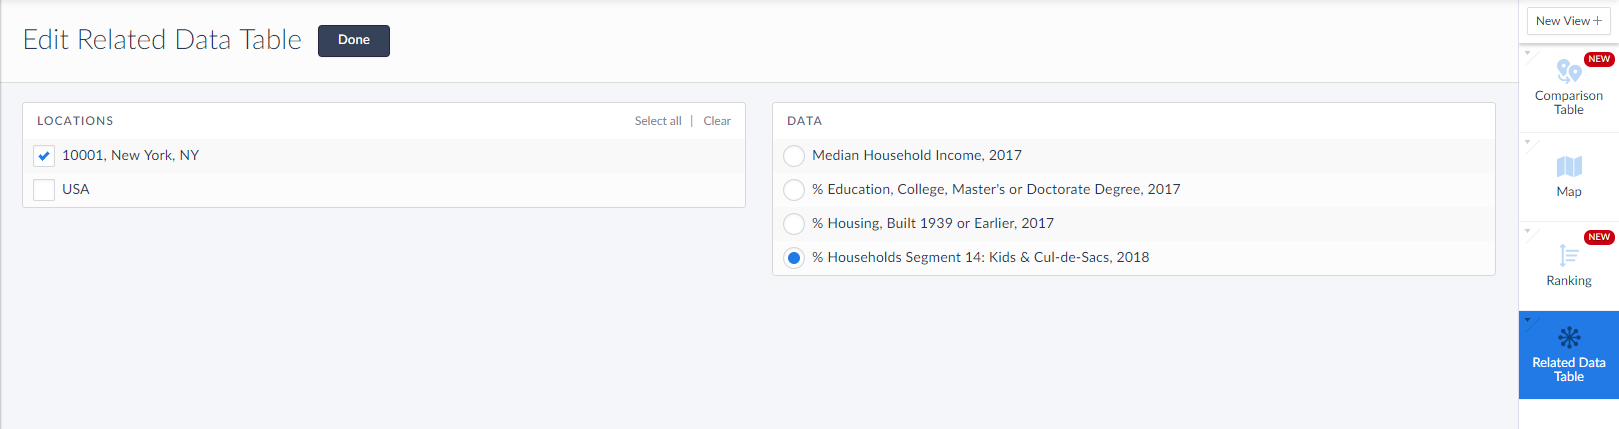
Select Done once the location and data variable have been added, and the report will generate.
Click on the Location/column header to sort either Ascending or Descending. It looks like the ZIP Code 10001 in New York is largely classified as Connected Bohemians.
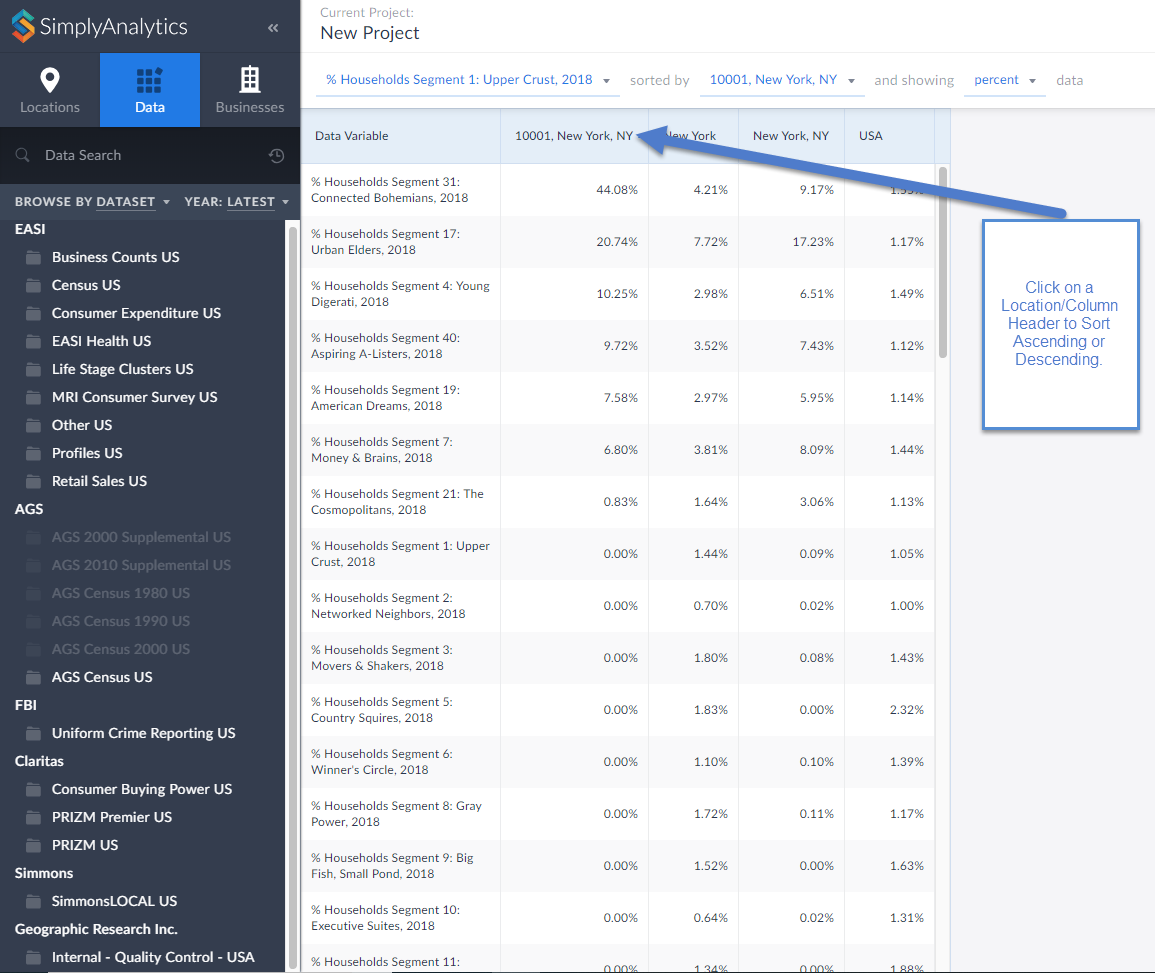
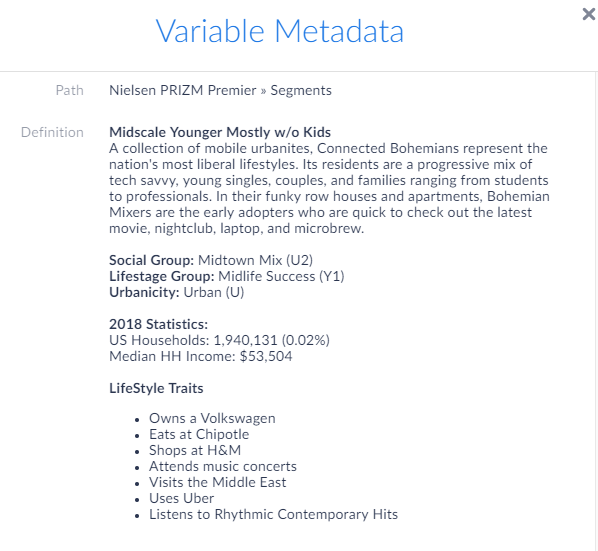
Click on the variable title to view the Metadata and learn more about this segment.
Interesting stuff! If your organization is interested in having a trial or webinar of the PRIZM dataset featured here, feel free to reach out to: support@simplyanalytics.com
More from SimplyAnalytics
Posted on Apr 23, 2018 by Admin
Hello everyone and welcome to this week’s blog. This week we will discuss how to create and utilize filters for your research. Why Use a Filter? Filters are a great way to identify target...
Posted on Mar 02, 2015 by Admin
In this week’s SimplyMap tip, we outline the process of creating a radius location. Radius locations are a great way to quickly gather information from an area surrounding a target addres...
Posted on Apr 27, 2015 by Admin
In this week’s write up we want to share some quick tips and tricks that you might not yet know about in SimplyMap. TIP #1 Did you know that you can share your work? SimplyMap allows you ...
Posted on Sep 01, 2008 by Admin
The King County Library System in Washington State now subscribes to SimplyMap, and has published a brief review on their blog, Library Talk.
Posted on Jul 30, 2018 by Admin
Hello readers! Welcome to this week’s blog. This week we will feature the Related Data Table view and how you can use it to maximize your productivity in SimplyAnalytics. What is it? The ...
Posted on Apr 30, 2020 by Admin
We find ourselves in the middle of an unprecedented crisis the likes of which most of us have never experienced before, and hopefully won’t have to experience again. There is the occasion...
Posted on Jun 01, 2014 by Admin
Visit the SimplyMap team at the ALA Annual Conference and Exposition in Las Vegas later this month. We will be at booth 1271, offering product demonstrations, tips & tricks, and of co...
Posted on Dec 02, 2014 by Admin
Today we take a look at one of the more advanced features in SimplyMap - editing the map legend. Editing the map legend is a great way to not only customize how the data is distributed on...
Posted on Dec 16, 2015 by Admin
Visit the SimplyMap team at the ALA Midwinter Meeting 2016 in Boston. We will be at booth #1913 offering product demonstrations, tips & tricks, and of course Ghirardelli Chocolate! Ex...
Posted on Nov 06, 2013 by Admin
SimplyMap includes a number of helpful support tools; guided wizards available when and where you need them, detailed help files, and an online support center with FAQs and searchable kno...