


Retail Market Power: Manhattan’s Jewelry and Car Sales
Posted on Jul 26, 2016 by Admin
In this week’s SimplyMap report, we’ll take a look at the Retail Market Power dataset and provide a simple, effective example of how the data package can be used. If your institution currently does not subscribe to Retail Market Power, please have a representative reach out to set up a free trial.
What is Retail Market Power?
The Nielsen Retail Market Power database provides an actionable portrait of sales opportunity for market analysis, so marketers can maximize growth strategies by identifying and closing the sales gaps that exist in the marketplace. By using sales potential to depict supply, and geography-based estimates of potential annual consumer expenditures to depict demand, Retail Market Power enables an opportunity gap analysis of the retail environment.
Example - NYC’s Jewelry and Vehicle Sales
By analyzing a geography’s retail sales and expenditures within an industry, you can determine whether or not a gap or opportunity exists. Let’s look at some data.
In a Standard Report, add the following four variables for analysis. They can be found at this path if your institution subscribes to the package: Retail Market Power » Expenditures » Jewelry:
Retail Sales for Jewelry (HH Avg), 2016
Retail Sales for Jewelry ($), 2016
Expenditures for Jewelry (HH Avg), 2016
Expenditures for Jewelry ($), 2016
Open the Locations panel and add in New York County which is coterminous with Manhattan. Close out the panel to generate your report. Results below:
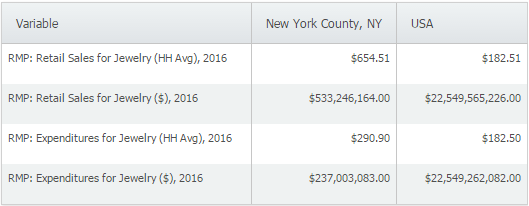
What does this mean?
In effect, the data is showing that people are coming from outside of Manhattan to purchase their jewelry. How do we know this? The retail sales for jewelry in Manhattan ($533,246,164) far exceeds what Manhattan residents are spending themselves on jewelry ($237,003,083). It’s fair to assume Manhattan’s renowned diamond district is driving the high sales.
Now let’s take a look at the reverse. In separate Standard Report, add the following variables:
Retail Sales for Cars, Trucks, and Other Powered Transportation (HH Avg), 2016
Retail Sales for Cars, Trucks, and Other Powered Transportation ($), 2016
Expenditures for Cars, Trucks, and Other Powered Transportation (HH Avg), 2016
Expenditures for Cars, Trucks, and Other Powered Transportation ($), 2016
Select Recent from the Locations panel to quickly add in New York County once again and close out the panel to generate your report.
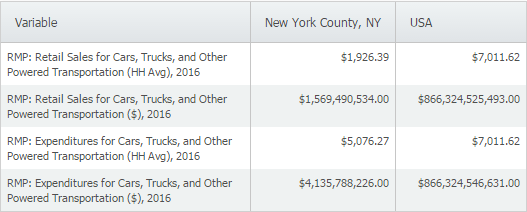
The data here reveals that Manhattan residents are purchasing their cars, trucks and other vehicles from outside of Manhattan - this seems logical as there is limited real estate within Manhattan to support many large car dealerships.
We hope you found this quick write up useful - is there any other industries or locations you’d like to see? Let us know in the comments, and stay tuned for more!
More from SimplyAnalytics
Posted on Jan 28, 2010 by Admin
Come visit the Geographic Research booth at the Ontario Library Association Super Conference, February 24-27, 2010 at the Metro Toronto Convention Centre. The Ontario Library Association ...
Posted on Dec 12, 2011 by Admin
Men's Health magazine has published a ranked list to help readers find the cities where Americans are the saddest and where they are living with big smiles on their faces. As they note, "...
Posted on Oct 16, 2015 by Admin
Did you know that SimplyMap includes the ability to export Shapefile data for use in desktop mapping software (such as MapInfo or ArcGIS)? This advanced feature extends the power of Simpl...
Posted on May 08, 2018 by Admin
We will be exhibiting at the SLA conference in Baltimore, MD this June. Stop by booth #912 and say hello - we look forward to demonstrating SimplyAnalytics, answering your questions, and ...
Posted on May 06, 2013 by Admin
The GRI team is looking forward to exhibiting at SLA 2013 at the San Diego Convention Center, June 9th through the 11th. The Special Libraries Association (SLA) is a nonprofit global orga...
Posted on Apr 17, 2018 by Admin
The SimplyAnalytics team would like to congratulate Rachel Holder, MLS candidate at Indiana University for being selected as this year's recipient of the BRASS Student Travel Award! ...
Posted on Aug 26, 2015 by Admin
Most people in the United States could probably guess which cities are popular amongst tourists - Los Angeles and New York. But can you guess how much money is spent in novelty and souven...
Posted on Jun 09, 2021 by Admin
Hello readers! SimplyAnalytics will be exhibiting at the Virtual ALA Annual Conference this year on June 23-26. Be sure to drop by our booth, and click the banner image to video chat with...
Posted on May 06, 2016 by Admin
Visit us at booth #775 at the ALA 2016 annual conference to meet the SimplyMap team and learn more about the features and functions behind SimplyMap. Have a Ghirardelli Chocolate while we...
Posted on Dec 15, 2014 by Admin
Visit the SimplyMap team at the ALA Midwinter Meeting in Chicago late January. We will be at booth #2824 offering product demonstrations, tips & tricks, and of course Ghirardelli Choc...