


Retail Market Power: Manhattan’s Jewelry and Car Sales
Posted on Jul 26, 2016 by Admin
In this week’s SimplyMap report, we’ll take a look at the Retail Market Power dataset and provide a simple, effective example of how the data package can be used. If your institution currently does not subscribe to Retail Market Power, please have a representative reach out to set up a free trial.
What is Retail Market Power?
The Nielsen Retail Market Power database provides an actionable portrait of sales opportunity for market analysis, so marketers can maximize growth strategies by identifying and closing the sales gaps that exist in the marketplace. By using sales potential to depict supply, and geography-based estimates of potential annual consumer expenditures to depict demand, Retail Market Power enables an opportunity gap analysis of the retail environment.
Example - NYC’s Jewelry and Vehicle Sales
By analyzing a geography’s retail sales and expenditures within an industry, you can determine whether or not a gap or opportunity exists. Let’s look at some data.
In a Standard Report, add the following four variables for analysis. They can be found at this path if your institution subscribes to the package: Retail Market Power » Expenditures » Jewelry:
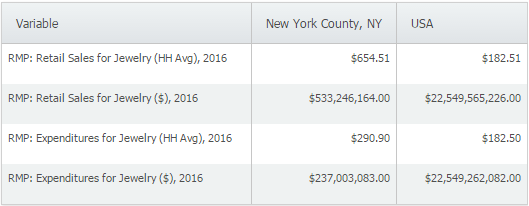
Retail Sales for Jewelry (HH Avg), 2016
Retail Sales for Jewelry ($), 2016
Expenditures for Jewelry (HH Avg), 2016
Expenditures for Jewelry ($), 2016
Open the Locations panel and add in New York County which is coterminous with Manhattan. Close out the panel to generate your report. Results below:
What does this mean?
In effect, the data is showing that people are coming from outside of Manhattan to purchase their jewelry. How do we know this? The retail sales for jewelry in Manhattan ($533,246,164) far exceeds what Manhattan residents are spending themselves on jewelry ($237,003,083). It’s fair to assume Manhattan’s renowned diamond district is driving the high sales.
Now let’s take a look at the reverse. In separate Standard Report, add the following variables:
Retail Sales for Cars, Trucks, and Other Powered Transportation (HH Avg), 2016
Retail Sales for Cars, Trucks, and Other Powered Transportation ($), 2016
Expenditures for Cars, Trucks, and Other Powered Transportation (HH Avg), 2016
Expenditures for Cars, Trucks, and Other Powered Transportation ($), 2016
Select Recent from the Locations panel to quickly add in New York County once again and close out the panel to generate your report.
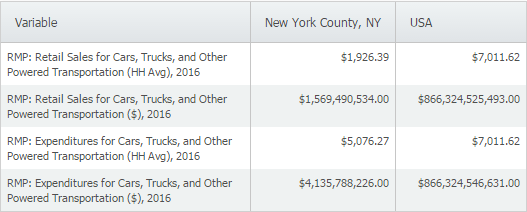
The data here reveals that Manhattan residents are purchasing their cars, trucks and other vehicles from outside of Manhattan - this seems logical as there is limited real estate within Manhattan to support many large car dealerships.
We hope you found this quick write up useful - is there any other industries or locations you’d like to see? Let us know in the comments, and stay tuned for more!
More from SimplyAnalytics
Posted on Sep 15, 2016 by Admin
While creating a radius location is the fastest and easiest method for creating a custom location, there may be situations that require a more specific and targeted locale. Let’s say for ...
Posted on Aug 22, 2009 by Admin
Lynda Kellam, the Data Services & Government Information Librarian at the University of North Carolina, Greensboro has produced some new tutorial videos to help students learn how to ...
Posted on Dec 02, 2019 by Admin
Hi everybody! We’re back this week with another question from our Help Desk. This time featuring SimplyAnalytics Canada. Let’s get started! Question: How can I analyze all of the PRIZM5 s...
Posted on Jul 28, 2013 by Admin
We recently discovered some interesting data on participation and attitudes towards recycling, and decided to dig a bit deeper into our Experian SimmonsLOCAL data. This data package inclu...
Posted on Sep 10, 2019 by Admin
Hello readers! It’s been a minute since our last tutorial post, but you can expect to see more content on a weekly basis moving forward. “From the Help Desk” is a new feature on the blog ...
Posted on Feb 21, 2018 by Admin
We are looking forward to sharing SimplyAnalytics with the public library community at the upcoming PLA 2018 Conference in Philadelphia, PA. Our team will be exhibiting in Booth #855. Vis...
Posted on Jun 09, 2016 by Admin
In this week’s blog, we’ll be featuring our newest data offering, PRIZM® Premier. If your institution currently subscribes to PRIZM data, this new module is available at no additional cos...
Posted on Dec 15, 2014 by Admin
Custom Locations allow SimplyMap users to combine several locations into one larger region. For example, you can use this feature to combine three adjacent ZIP Codes to create your study ...
Posted on Mar 02, 2015 by Admin
In this week’s SimplyMap tip, we outline the process of creating a radius location. Radius locations are a great way to quickly gather information from an area surrounding a target addres...
Posted on Nov 28, 2012 by Admin
Come visit the SimplyMap team at the ALA Midwinter Meeting, January 25 - 28, 2013 in Seattle, WA. We will be in Booth 1307, and as always we look forward to meeting with customers new and...