


From the Help Desk - How Do I Generate a List of All Restaurants in my City?
Posted on Sep 10, 2019 by Admin
Hello readers! It’s been a minute since our last tutorial post, but you can expect to see more content on a weekly basis moving forward. “From the Help Desk” is a new feature on the blog where we select a question sent to the Help Desk and share our response with the SimplyAnalytics community. Please send us your feedback and let us know if you like it - let’s get started!
Question: How do I generate a list of all the restaurants in my city?
You can use a Business Table to generate a list of businesses in any location. In your project:
1. Select New View at the top-right and Create under the Business Table heading.
2. Select the Businesses button on the left - this question requires use of the Advanced Business Search feature.
3. Select, “Use Advanced Search” - set the first dropdown to NAICS, then select “starts with” and lastly type in the word restaurant. A list of related businesses will appear.
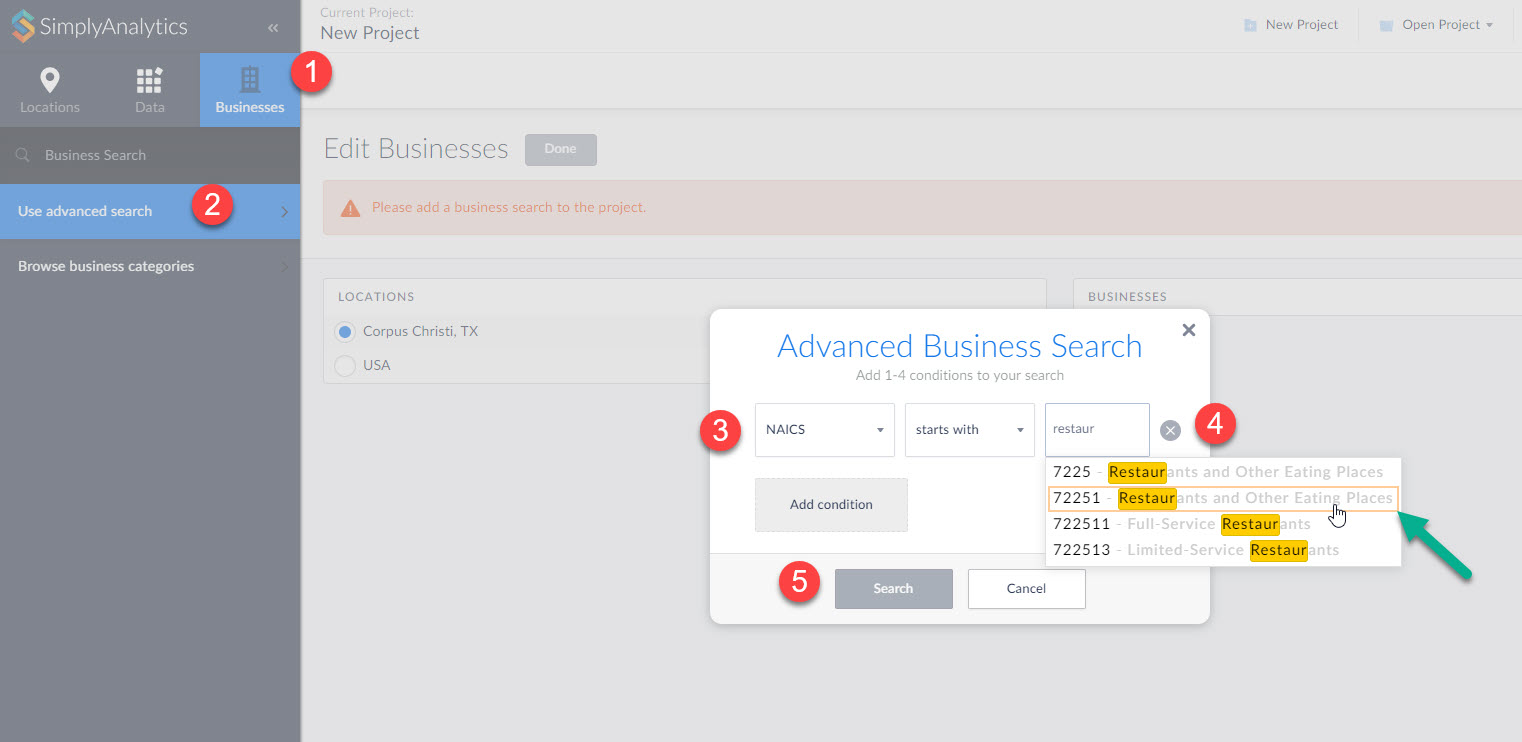
4. Click on 72251 – this query is then setup to include 722511 (full service) and 722513 (limited service).
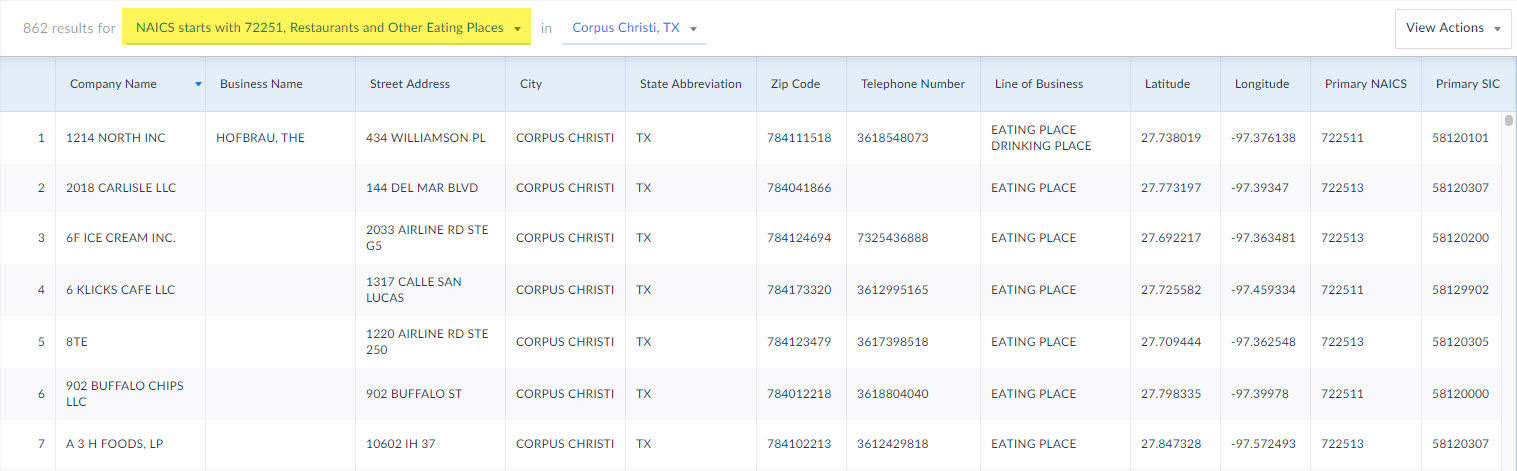
5. Click search, then Done on the Edit View page to generate your report.
And that’s all there is! Please let us know if you run into any issues generating your business reports. Email: support@simplyanalytics.com
More from SimplyAnalytics
Posted on Mar 02, 2009 by Admin
ACRL's 14th National Conference will be held at the Washington State Trade and Convention Center in downtown Seattle, March 12-15, 2009. Every other year, ACRL offers its premier profe...
Posted on Jun 07, 2011 by Admin
We will be exhibiting at the Special Library Association Annual Conference in Philadelphia and the American Library Association conference in New Orleans later this month. Come and visit ...
Posted on Mar 14, 2010 by Admin
The GRI team was honored to learn that SimplyMap was included in this year's Choice Outstanding Academic Title List, published in the January 2010 issue of Choice Magazine. This is a grea...
Posted on Apr 14, 2016 by Admin
This week’s SimplyMap report will provide an overview of one of the more advanced functionalities in SimplyMap - applying multiple filter conditions. Filters can be applied to any map or ...
Posted on May 26, 2016 by Admin
In this week’s report exploring SimplyMap data, we take a look at the variables available relative to internet search engines used. The source of this data will come from the SimmonsLOCAL...
Posted on Sep 01, 2008 by Admin
The King County Library System in Washington State now subscribes to SimplyMap, and has published a brief review on their blog, Library Talk.
Posted on Jun 08, 2015 by Admin
In this week’s report we take a look at one folder found within SimplyMap’s SimmonsLOCAL data package. SimmonsLOCAL is a powerful targeting and profiling system that provides insights int...
Posted on Sep 27, 2019 by Admin
Hello readers! This week we provide an in-depth response to a question asking about the legend classification methods in SimplyAnalytics. This response is now part of our Help Center: htt...
Posted on Aug 22, 2009 by Admin
Lynda Kellam, the Data Services & Government Information Librarian at the University of North Carolina, Greensboro has produced some new tutorial videos to help students learn how to ...
Posted on Nov 03, 2017 by Admin
This week we’ll talk about one of our favorite features in SimplyAnalytics - the custom combination location. This feature is a simple and effective means to create custom geographies whe...