 Go up
Go up


Pizza Restaurants in Chicago's Loop
Posted on Feb 17, 2015 by Admin
Our recent trip to Chicago exhibiting at the ALA Midwinter Meeting inspired this week’s SimplyMap blog post. Today, we’re going to demonstrate how to use business points in SimplyMap to answer a basic question that a person opening a business might ask - what’s the competition like in the area?
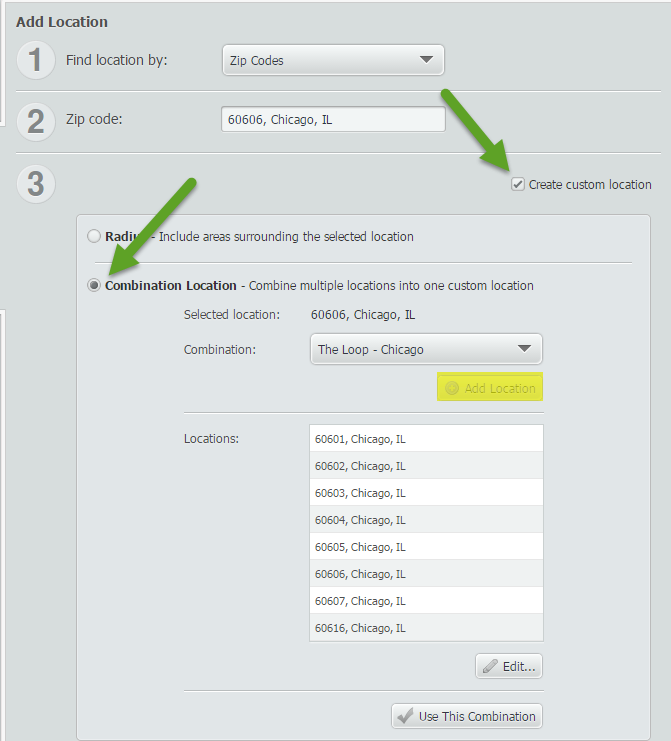
To emulate a real world scenario, we only want to look at a specific area. In this example, our location will be “The Loop” in Chicago. The Loop in Chicago is composed of these ZIP codes: 60601, 60602, 60603, 60604, and parts of 60605, 60606, 60607, and 60616.
First, create a custom location that is composed of the aforementioned ZIP codes.
 Next, select a pertinent variable for your map. In this example, we will use: Food away from home (Household Average), 2014 to identify the areas where people tend to eat out for meals.
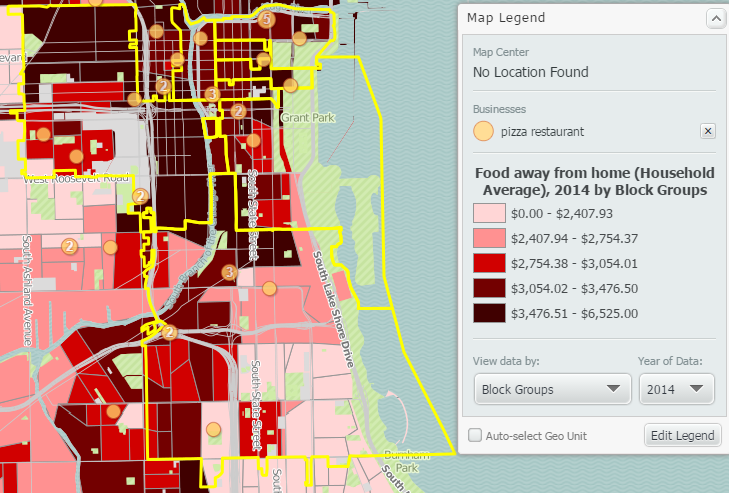
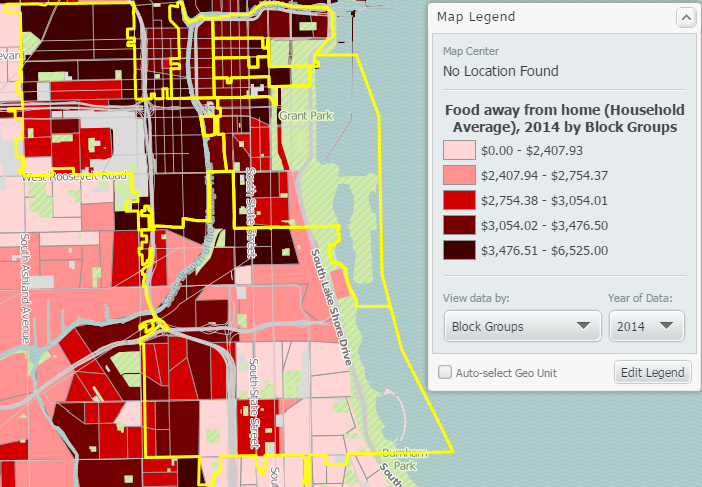 Now that you have a map showing the custom area mapped with the chosen variable, you can add the relevant business points.
Select “Businesses” from the left panel and type in the search “pizza restaurant”. Select “show businesses” and SimplyMap will place a point on the address of each relevant business.
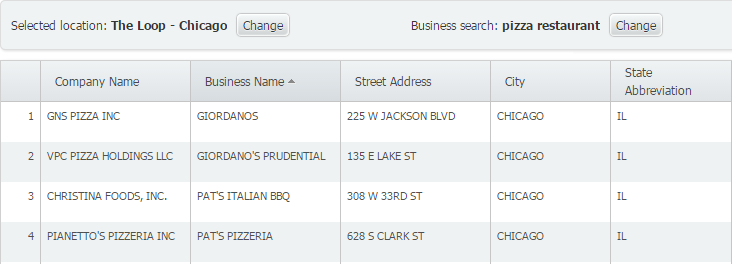
 Lastly, to see a list of these business points in a report, select “Actions” from the top right of SimplyMap and click “Make Report from Businesses”. Here’s a sample of what to expect:
We hope you enjoyed this week’s SimplyMap report. Stay tuned for more interesting reports and tips!
Have you already entered for your chance to win an iPad or Kindle Fire? We will be holding the drawing on April 17, 2015. To enter, simply follow us on Twitter and Like Us on Facebook to get your name in consideration.
More from SimplyAnalytics


Posted on Mar 30, 2016 by Admin
In previous blog entries we highlighted the usefulness of viewing multiple years of data for the same variable. In short, analyzing the same variable across multiple years allows users to...
Posted on Sep 01, 2008 by Admin
The King County Library System in Washington State now subscribes to SimplyMap, and has published a brief review on their blog, Library Talk.
Posted on Dec 02, 2014 by Admin
Today we take a look at one of the more advanced features in SimplyMap - editing the map legend. Editing the map legend is a great way to not only customize how the data is distributed on...
Posted on May 18, 2015 by Admin
The SimplyMap team is looking forward to visiting with customers and others at the SLA Annual Conference, coming to Boston on June 14-16. Come visit us at Booth #916, we are happy to answ...
Posted on Jan 10, 2024 by Admin
We are delighted to announce our sponsorship of the Midwest Entrepreneurship Case Competition! At SimplyAnalytics, we understand the power of data-driven decision-making in entrepreneursh...
Posted on Oct 30, 2018 by Admin
We are pleased to be exhibiting at this year's 30th Annual Charleston Library Conference! The Charleston Vendor Showcase will be held Tuesday, November 6, 2018, from 10:30 a.m. to 6:00 p....
Posted on Apr 30, 2020 by Admin
We find ourselves in the middle of an unprecedented crisis the likes of which most of us have never experienced before, and hopefully won’t have to experience again. There is the occasion...
Posted on Sep 05, 2019 by Admin
We are pleased to be exhibiting again at the Charleston Library Conference, on Tuesday November 5th, 2019. The Vendor Showcase will be held in the Gaillard Center Grand Ballroom (95 Calho...
Posted on May 10, 2016 by Admin
One benefit of data and applications like SimplyMap is the ability to visualize information. In this week’s report, we’ll take a quick look at some branding preferences in contiguous Amer...
Posted on Nov 20, 2015 by Admin
In a previous blog we demonstrated the power of utilizing multiple years for the same variable. We found that the usage of Amazon.com had grown substationally from 2008-2014. In this week...