


Exploring SimplyMap Data: Retail Market Power
Posted on Apr 10, 2015 by Admin
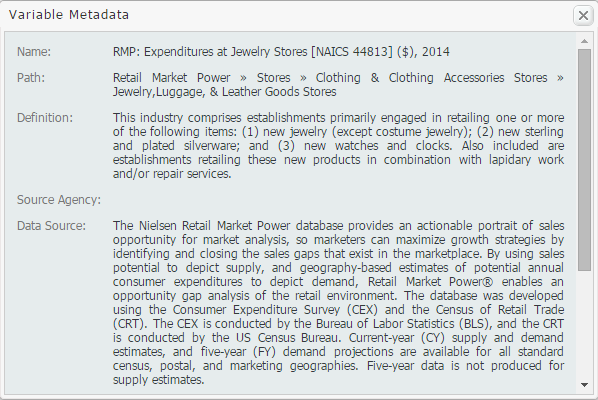
In this week’s SimplyMap report, we explore one of the newer datasets available: Retail Market Power®.
What is it? In short, the Retail Market Power® dataset helps users identify opportunities within the industry they are targeting. These gaps are identified by analyzing expenditures and retail sales. Marketers can focus on targeting areas where the expenditures far exceed the total sales.
Let’s take a look at an example.
Scenario: You are thinking of opening up a jewelry store in your ZIP code, but first you want to determine if there is a need for one, and discover if people in the area readily buy jewelery.
Solution: First, open a Standard Report and use your ZIP code as the location. Next, navigate through the Retail market Power category in the Variables menu to find jewelry store expenditures and sales in your location. After selecting the correct variables, close out the Variables menu to generate your report.

 The report is shown below:

According to the above results, there is a fairly large gap in the jewelry store industry in the 44146 ZIP code where expenditures are greatly exceeding sales. Many residents must be spending their money at jewelry stores outside of the ZIP code, creating an opportunity for more jewelry stores to site locally.
The above scenario is a brief look at this dataset. Explore the other 17 category folders and let us know some interesting figures you come across!
Lastly, don’t forget to enter into our Winter Sweepstakes where we’ll be giving away an iPad and Kindle Fire! Details here: Winter Sweepstakes!
More from SimplyAnalytics
Posted on Aug 22, 2009 by Admin
Lynda Kellam, the Data Services & Government Information Librarian at the University of North Carolina, Greensboro has produced some new tutorial videos to help students learn how to ...
Posted on Sep 09, 2015 by Admin
This week’s SimplyMap report will set out to discover what America’s favorite type of music is. We will use data within the premium data package, SimmonsLOCAL to answer the question. The ...
Posted on Apr 18, 2017 by Admin
We look forward to attending the Texas Library Association Conference this week in San Antonio and visiting with the library community. Stop by our new SimplyAnalytics booth (2029) and ta...
Posted on Aug 20, 2015 by Admin
Is there a specific age group and income bracket you are specifically interested in researching for a target location? Our Life Stages module has the information you need. Life Stages, by...
Posted on May 06, 2013 by Admin
We will be exhibiting at ALA 2013 at McCormick Place in Chicago, IL, June 28-July 1. The ALA Annual Conference programs, updates, conversations, and other events cover all of the key issu...
Posted on Feb 27, 2009 by Admin
Geographic Research, Inc. is pleased to participate in the Statewide California Electronic Library Consortium's (SCELC) 12th Annual Vendor Day. SCELC members and librarians from other aca...
Posted on Oct 23, 2009 by Admin
SimplyMap was highlighted in the Wake County, NC Public Library Business Blog today as a valuable tool for business planning. Wake County has access to SimplyMap through NC LIVE, a statew...
Posted on Dec 03, 2012 by Admin
Come visit the Geographic Research booth at the Ontario Library Association Super Conference this season. The conference will take place on January 30 - February 2, 2013 at the Metro Toro...
Posted on Jan 23, 2015 by Admin
SimplyMap offers a total of 5 unique types of reports: Standard Report, Ranking Report, Business Report, Ring Study, and Location Analysis. This brief write up will define what each repor...
Posted on Sep 14, 2021 by Admin
Welcome readers! Today we are excited to welcome histograms to SimplyAnalytics. We hope you enjoy this wonderful new visualization as much as we do. Let’s take a look. What is a histogram...