


SimplyMap Tip - Choosing the Correct Report
Posted on Jan 23, 2015 by Admin
SimplyMap offers a total of 5 unique types of reports: Standard Report, Ranking Report, Business Report, Ring Study, and Location Analysis. This brief write up will define what each report does, and provide a real-world example of each.
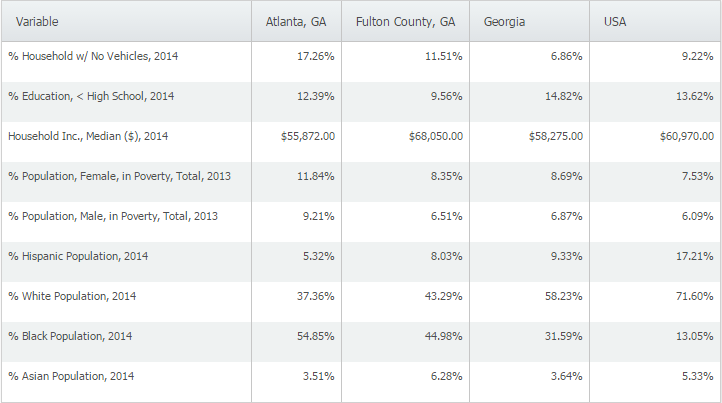
Standard Report definition - a table comparing multiple variables across several locations/location types.
Standard Report real-world use - you are applying for a grant for your city, and would like to analyze some socioeconomic variables to compare your city against the county, state, and United States.
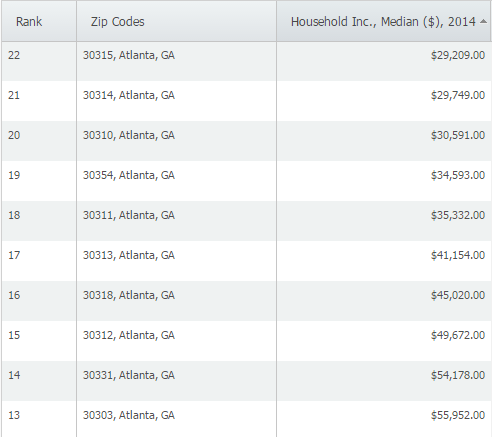
Ranking Report definition - a table ranking up to 250 locations within a single geography (ex. zipcodes within a city) and single data variable.
Ranking Report real-world use - you are looking for a target area to open up a social program for low income areas and want to rank ZIP Codes in Atlanta, GA from lowest median income up.
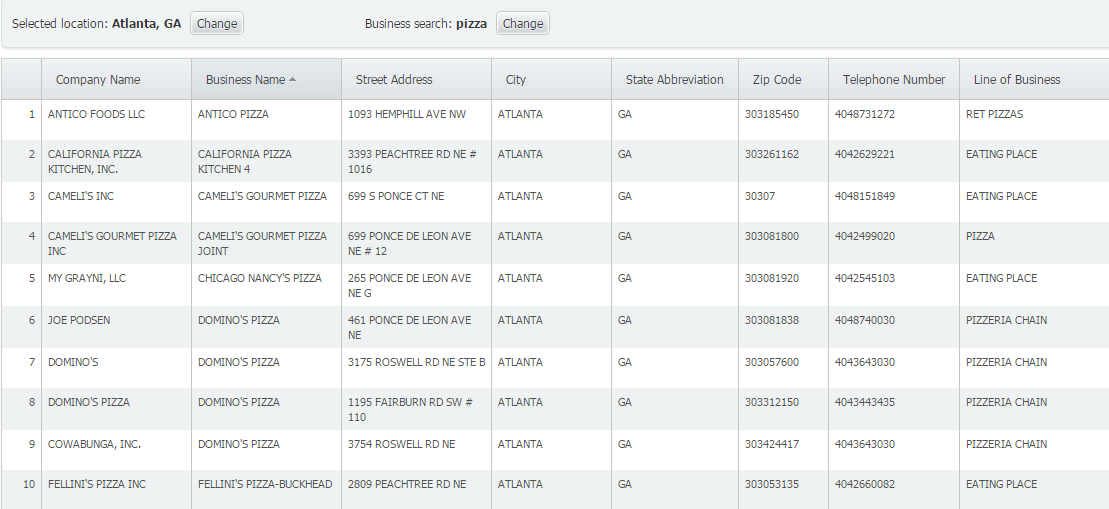
Business Report definition - generates a report showing all businesses that meet your search criteria within a given location.
Business Report real-world use - you are thinking of opening up a pizza restaurant in a city, so you want to see a list of how many pizza restaurants already exist close to your desired location.
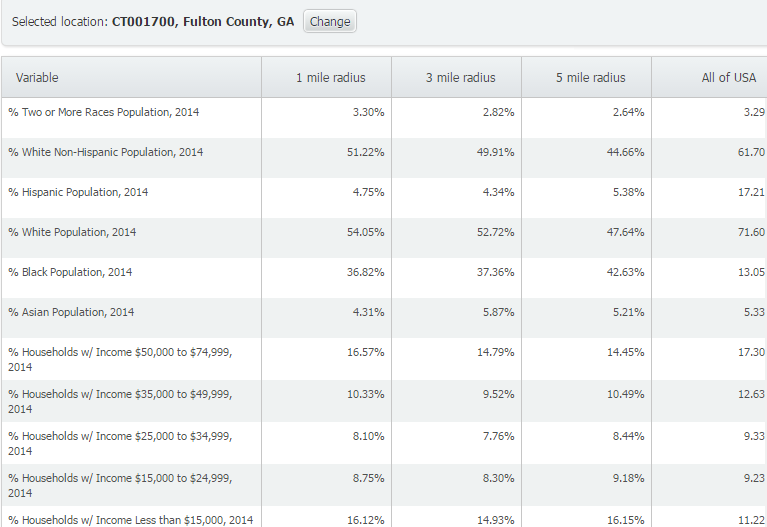
Ring Study definition - a demographic analysis of a target area based on a 1, 3, or 5 mile (or kilometer) radius around a location.
Ring Study real-world use - use to compare different variables in the immediate area, within a specified radius around the selected location.
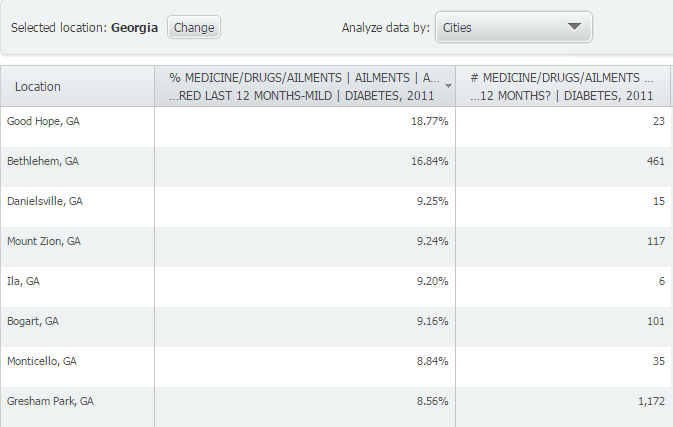
Location Analysis definition - view & compare data for all counties in a state, ZIP codes in a city, census tracts in a county, etc.
Location Analysis real-world use - A medical equipment provider may review health data in a Location Analysis to identify cities in the state to consider visiting to market equipment for an ailment.
Stay tuned for more SimplyMap tips, and don’t forget to follow us on Twitter and like us on Facebook!
More from SimplyAnalytics
Posted on Nov 20, 2015 by Admin
In a previous blog we demonstrated the power of utilizing multiple years for the same variable. We found that the usage of Amazon.com had grown substationally from 2008-2014. In this week...
Posted on Mar 14, 2010 by Admin
The GRI team was honored to learn that SimplyMap was included in this year's Choice Outstanding Academic Title List, published in the January 2010 issue of Choice Magazine. This is a grea...
Posted on Sep 14, 2021 by Admin
Welcome readers! Today we are excited to welcome histograms to SimplyAnalytics. We hope you enjoy this wonderful new visualization as much as we do. Let’s take a look. What is a histogram...
Posted on Nov 11, 2015 by Admin
Inspired by a recent help desk ticket, we wanted to discuss how users may utilize SimplyMap to identify relationships between unique variables. For example, does having a college degree s...
Posted on Sep 15, 2016 by Admin
While creating a radius location is the fastest and easiest method for creating a custom location, there may be situations that require a more specific and targeted locale. Let’s say for ...
Posted on Nov 06, 2019 by Admin
Hello readers! We hope you’re having a wonderful week. Today we feature another entry from our From the Help Desk series. Let’s get started! Question: How do I analyze data for downtown? ...
Posted on Nov 04, 2013 by Admin
SimplyMap 3.0 is here, and uses the latest technology to provide better performance, improved reliability, and powerful new features. There are many improvements designed to make it easie...
Posted on Oct 30, 2018 by Admin
We are pleased to be exhibiting at this year's 30th Annual Charleston Library Conference! The Charleston Vendor Showcase will be held Tuesday, November 6, 2018, from 10:30 a.m. to 6:00 p....
Posted on Nov 22, 2016 by Admin
We will be exhibiting at ALA Midwinter in Atlanta, Georgia in January. You can find the GRI team at Booth 1155, where we will be catching up with customers old and new, and sharing some e...
Posted on Sep 15, 2025 by Admin
SimplyAnalytics will be attending the upcoming NCLA Conference in Winston-Salem October 14-17!