


Release Announcement
Posted on Nov 28, 2023 by Admin
Hello readers! We are happy to announce that SimplyAnalytics has successfully migrated to the Census 2020 boundaries on Sunday, November 19th. This blog will talk about what that is, what it means for you now, and what it means moving forward. Let’s get into it.
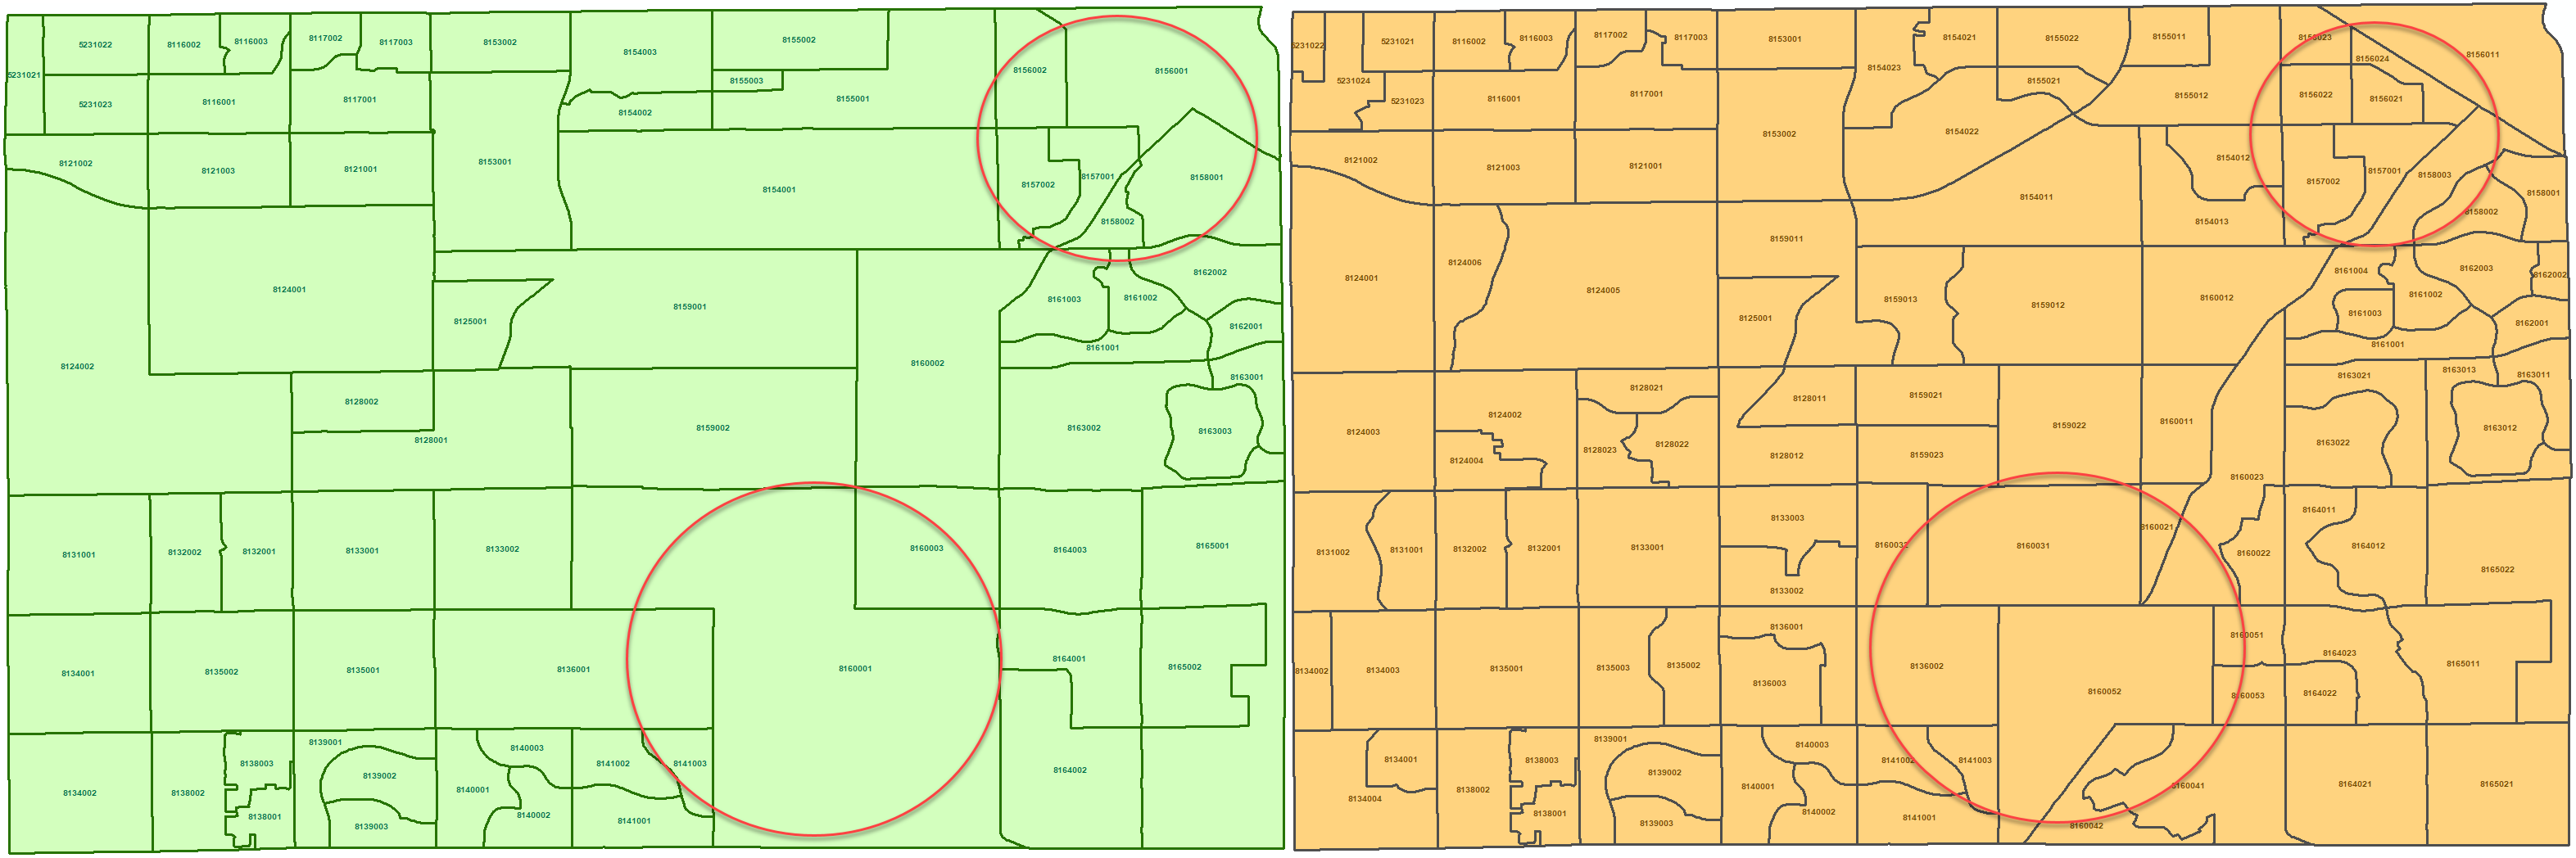
What is this migration all about?The United States Census Bureau provides updates to location boundaries every 10 years. They do this based on population changes and to ensure fair representation for locations that have changed over time. For example, maybe a Census Tract or Census Block Group has grown in population over time, and once it reaches a certain population threshold, that Census Tract or Block Group will get split up, and new Tracts or Block Groups will be created.
Check out the example below that highlights the same area in Arizona in 2019 (green), and then with updated boundaries in 2020 (orange).
If you’re interested in a more detailed overview of this, feel free to check out the video here: https://vimeo.com/user68002385/simplyanalytics-historical-mode?share=copy
What does it mean for SimplyAnalytics?By default, SimplyAnalytics is now in 2020 boundaries, and with that comes a host of newer data, including 2023 Community Demographics, the complete 2021 ACS (with 2022/23 estimates), The 2020 Decennial Census, and a new 2020 Election dataset - more on that in a future blog.
For returning users: If you are a returning user, you might notice that your views have a historical badge on them or that there’s a note at the top, and it’ll look like this:
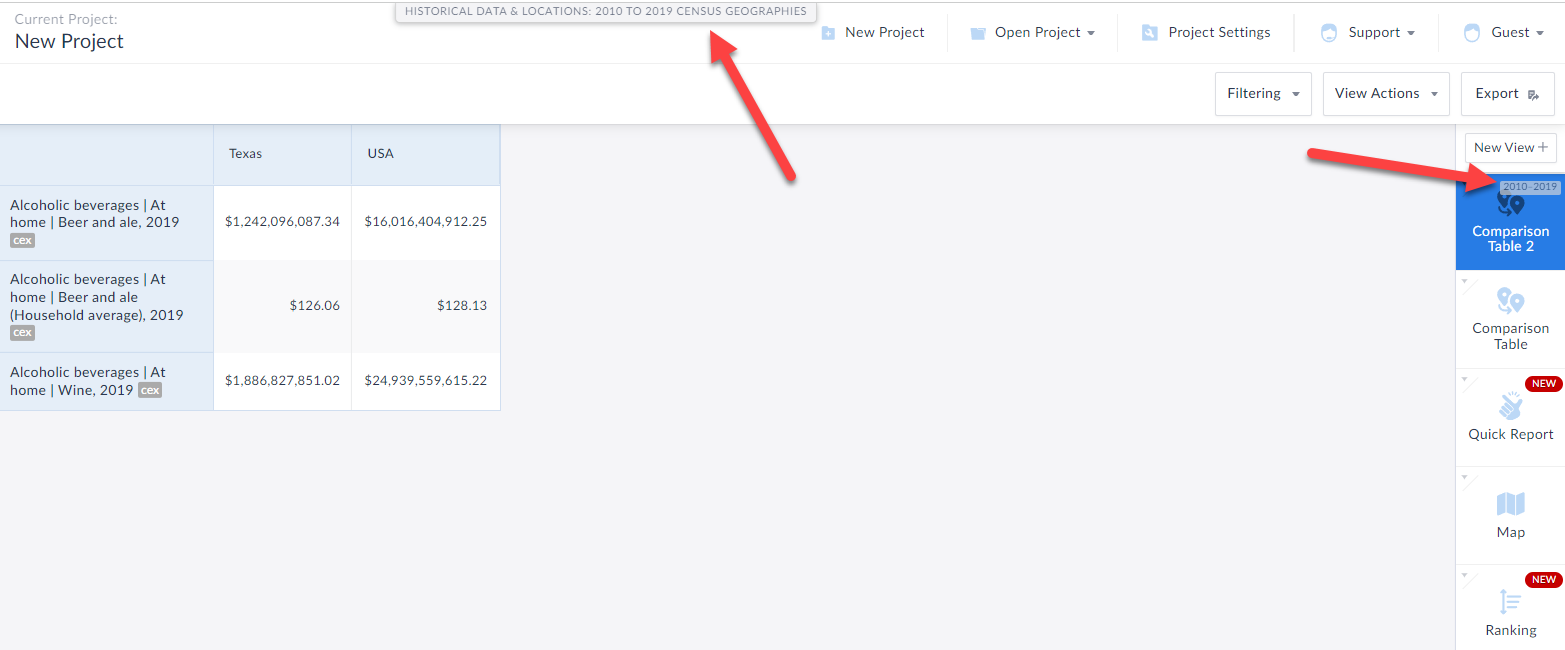
This is because all of your work prior to Nov. 19th, 2023, would have been in the older geographies, but as mentioned above SimplyAnalytics now defaults to 2020 Census boundaries.
What if I want to explore the newest data? If you want to use the newest data, simply click on New View at the top-right of the screen and proceed as you normally would. However, if you want to continue using the now older data, you’ll have to go into historical mode - similarly, some datasets are not yet migrated to the new boundaries, and so if you want to access those, you’ll need to use historical mode.
Final NotesFor existing/returning users, we understand that there might be some confusion with accessing some datasets that are not yet available in the newer geographies. But please note that this is temporary. As all future years of the datasets you’ve come to love come online, the only reason you’ll need to go into Historical Mode will be if you want older years of data which is how it has traditionally been.
As always, we are here to help! Please email support@simplyanalytics.com if you are running into any issues.
More from SimplyAnalytics
Posted on Jul 30, 2015 by Admin
One great feature within SimplyMap is the ability to track the same variable across multiple years. In this report, we will track the percentage of households in the US ordering items fro...
Posted on Jun 21, 2022 by Admin
Hello readers! We hope you’re having a great day. Today we are featuring 5 commonly asked questions about the American Community Survey dataset that’s available to all customers in Simply...
Posted on Jun 16, 2016 by Admin
This week’s SimplyMap report is a quick tip that we hope you find useful and time saving. Did you know that SimplyMap will save all recently searched business queries for future usage? Le...
Posted on Dec 07, 2021 by Admin
Hello readers! We hope you are enjoying the holiday season as much as we are. Today, we are happy to announce a couple of improvements to SimplyAnalytics designed to help you get your res...
Posted on Mar 18, 2015 by Admin
Can you guess which US city has the most residents per square mile? Today we’re going to use SimplyMap to answer this question for all cities, as well as cities with a population greater ...
Posted on Apr 07, 2020 by Admin
As COVID-19 spreads across the United States researchers need access to the latest data visualization and analytics tools. As a result, the SimplyAnalytics team just added COVID-19 data ...
Posted on Sep 01, 2008 by Admin
The King County Library System in Washington State now subscribes to SimplyMap, and has published a brief review on their blog, Library Talk.
Posted on Oct 07, 2024 by Admin
We're headed to Charleston! Come visit the SimplyAnalytics team on November 12th at the Gaillard Center at booth 41. We'll be doing live demonstrations of the database, answering question...
Posted on Jun 09, 2016 by Admin
In this week’s blog, we’ll be featuring our newest data offering, PRIZM® Premier. If your institution currently subscribes to PRIZM data, this new module is available at no additional cos...
Posted on Jul 09, 2015 by Admin
In this week’s SimplyMap report, we set out to find which cities have the highest percentages of people who use their bike as their mode of transportation to work in the US. Let’s get sta...