


Introducing Election Data
Posted on Dec 11, 2023 by Admin
Hello readers! We have some fantastic news to share. SimplyAnalytics is thrilled to announce the addition of 2020 Election data to our expanding collection of powerful datasets. With this latest update, you can now gain deeper insights into the electoral landscape of the United States, and best of all - this dataset is free and available now for all SimplyAnalytics customers! Let's delve into the significance of this update.
 Explore the 2020 Election Data:
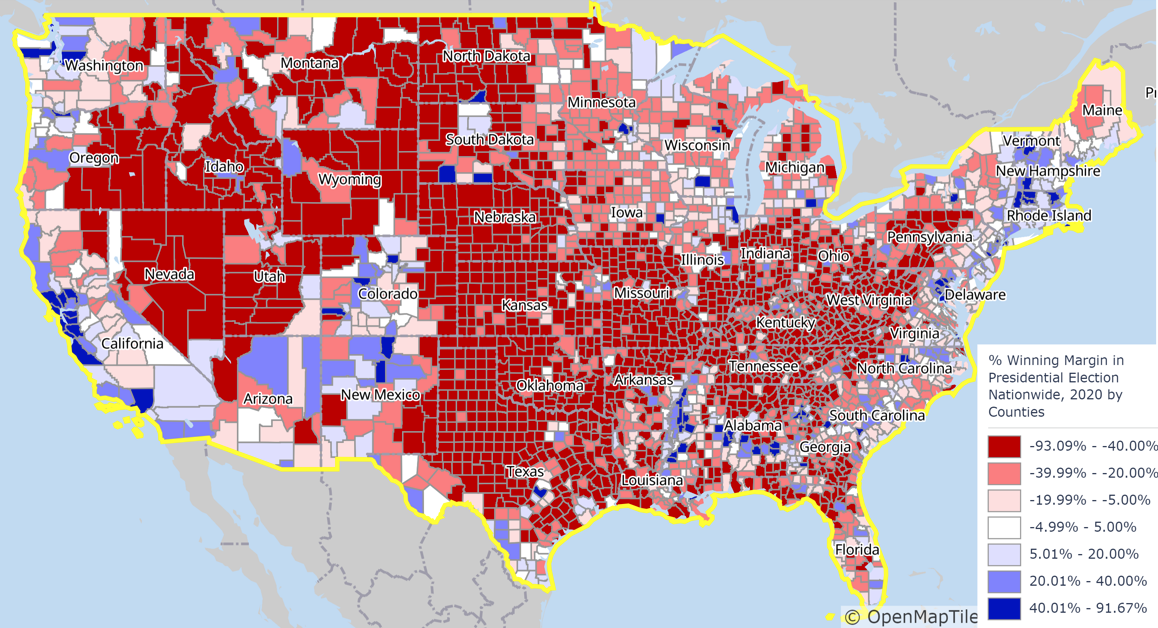
With the inclusion of 2020 Election data in SimplyAnalytics, you can access a comprehensive range of election information. Dive into county-level voting results for:
- Presidential (Winning margin, Democrat votes, Republican votes)
- US Senate (Winning margin, Democrat votes, Republican votes)
- US House (Winning margin, Democrat votes, Republican votes)
- Governor (Winning margin, Democrat votes, Republican votes)
You will also have the opportunity to analyze specific candidates in state-wide elections. For example, votes for Jon Ossoff versus David Perdue for the counties in Georgia or John Rutherford versus Donna Deegan in Florida’s 4th Congressional District.
Gain Actionable Insights & Commingle Data for a Holistic Picture:By analyzing 2020 Election data in SimplyAnalytics, you can identify voting patterns, assess the influence of different demographics, and uncover trends that shaped the final outcome.
With our intuitive mapping and visualization tools, you can also easily transform this raw 2020 Election data into visually engaging and easy-to-understand maps, charts, and graphs.
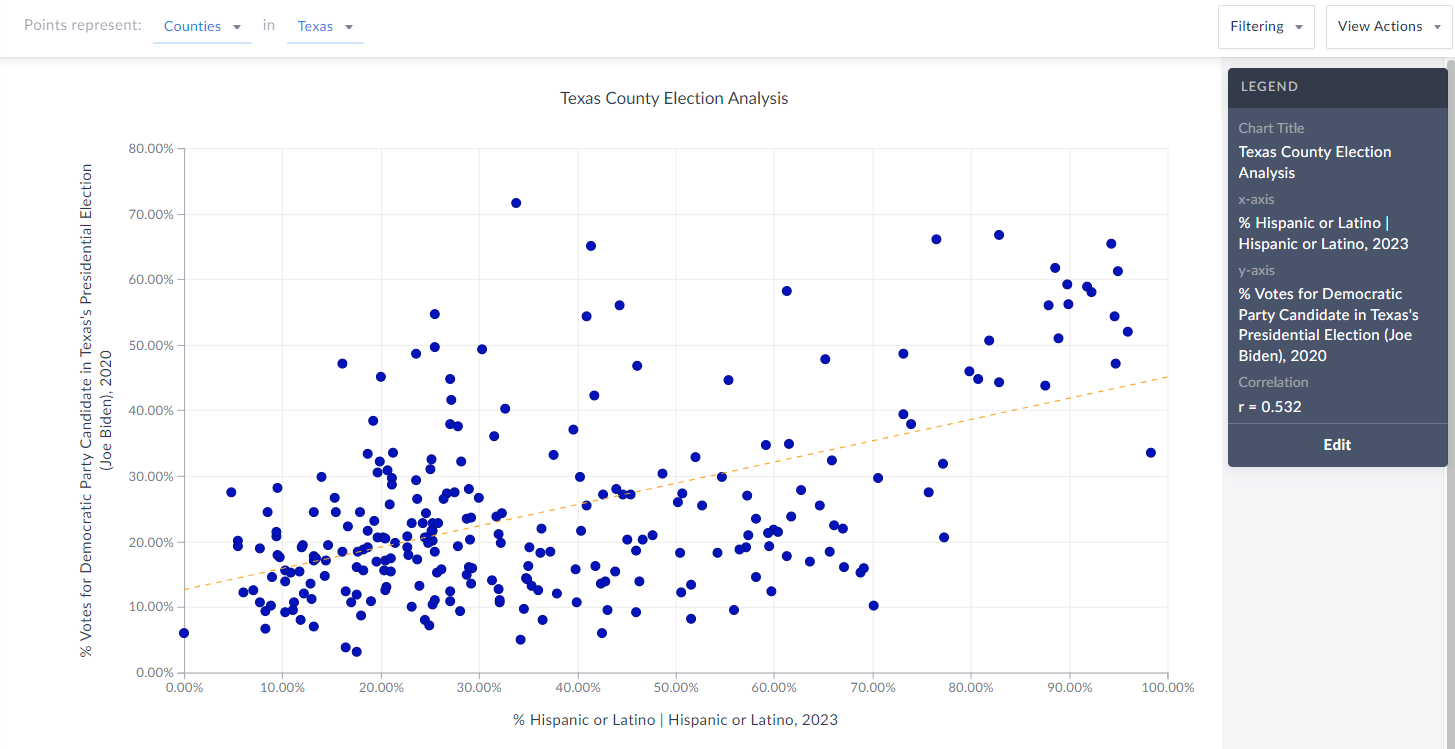
Of course, SimplyAnalytics also has the ability to combine datasets seamlessly. By co-mingling 2020 Election data with other demographic, marketing, psychographic or even health datasets, you can create a holistic picture of the election's results. For example, you can explore correlations between voting patterns and income levels or lifestyle data.
The addition of 2020 Election data to SimplyAnalytics is an exciting milestone, opening up new possibilities for exploration and analysis. Whether you are a researcher, student, business professional, or a data enthusiast, this update is sure to provide a valuable resource for better understanding the 2020 U.S. Presidential Election.
Log in to SimplyAnalytics now and start exploring. Have fun!
More from SimplyAnalytics
Posted on Jan 19, 2009 by Admin
The 2009 Midwinter Meeting will be held in Denver, CO, from Jan 23–28, 2009. http://www.ala.org/midwinter The exhibits will be held Jan 23–26, 2009 at the Colorado Convention Center,...
Posted on Apr 30, 2024 by Admin
Congratulations to Brandyn Whitaker as the recipient of the 2024 BRASS Student Travel Award! Brandyn is a Library Services Associate in the Workforce and Economic Development department a...
Posted on Apr 17, 2009 by Admin
The Special Libraries Association will hold its Annual Conference in Washington, DC at the Washington Walter E. Washington Convention Center from June 14-17 2009. The conference will crea...
Posted on Aug 27, 2018 by Admin
Welcome readers! This week we are excited to feature our newest view in SimplyAnalytics, the Time Series Table.What is it?The Time Series Table allows you to quickly pull all years availa...
Posted on Feb 19, 2016 by Admin
Drop by booth #857 at PLA 2016 to meet the SimplyMap team and learn more about the features and functions behind SimplyMap. Have a Ghirardelli Chocolate while we present SimplyMap and off...
Posted on Oct 08, 2019 by Admin
Hello readers! This week’s “From the Help Desk” is short & sweet. Let’s get to it! Question: How do I analyze all of the states at once in a report? Answer: The Ranking Report allows ...
Posted on Sep 15, 2016 by Admin
While creating a radius location is the fastest and easiest method for creating a custom location, there may be situations that require a more specific and targeted locale. Let’s say for ...
Posted on Oct 26, 2018 by Admin
Welcome readers! This week we’ll take a look at how to browse for data by category in SimplyAnalytics. Browsing by Category is the default way of browsing for data in SimplyAnalytics. It ...
Posted on May 08, 2018 by Admin
This summer's ALA conference is in New Orleans and the SimplyAnalytics team will be exhibiting at booth #837. We hope you stop by to learn about new features, check out our new data offer...
Posted on Nov 04, 2013 by Admin
SimplyMap 3.0 is here, and uses the latest technology to provide better performance, improved reliability, and powerful new features. There are many improvements designed to make it easie...