


Exploring SimplyMap Data: Life Stage Clusters
Posted on Aug 20, 2015 by Admin
Is there a specific age group and income bracket you are specifically interested in researching for a target location? Our Life Stages module has the information you need. Life Stages, by EASI is a premium data set available for trial or purchase to all SimplyMap subscribers. In this brief write up, we’ll take a look at some of the options available within this data package.
The Life Stages module is broken down into three folders:
Young Households - Very Young <25 and Young 25-34
Middle Age Households - Middle Age 35-44 and Late Middle Age 45-54
Older Households - Nearly Senior 55-64, Senior 65-74 and Oldest 75+
Each of these folders is further broken down by family types and income.The income data has three tiers: lower income, moderate income and higher income. Let’s get started with a demonstration.
Scenario: You want to analyze the city of Chicago by Life Stage clusters to identify high income, non-family households (young, middle age and older).
Step 1: Create a Location Analysis Report, and use the city of Chicago as your location.
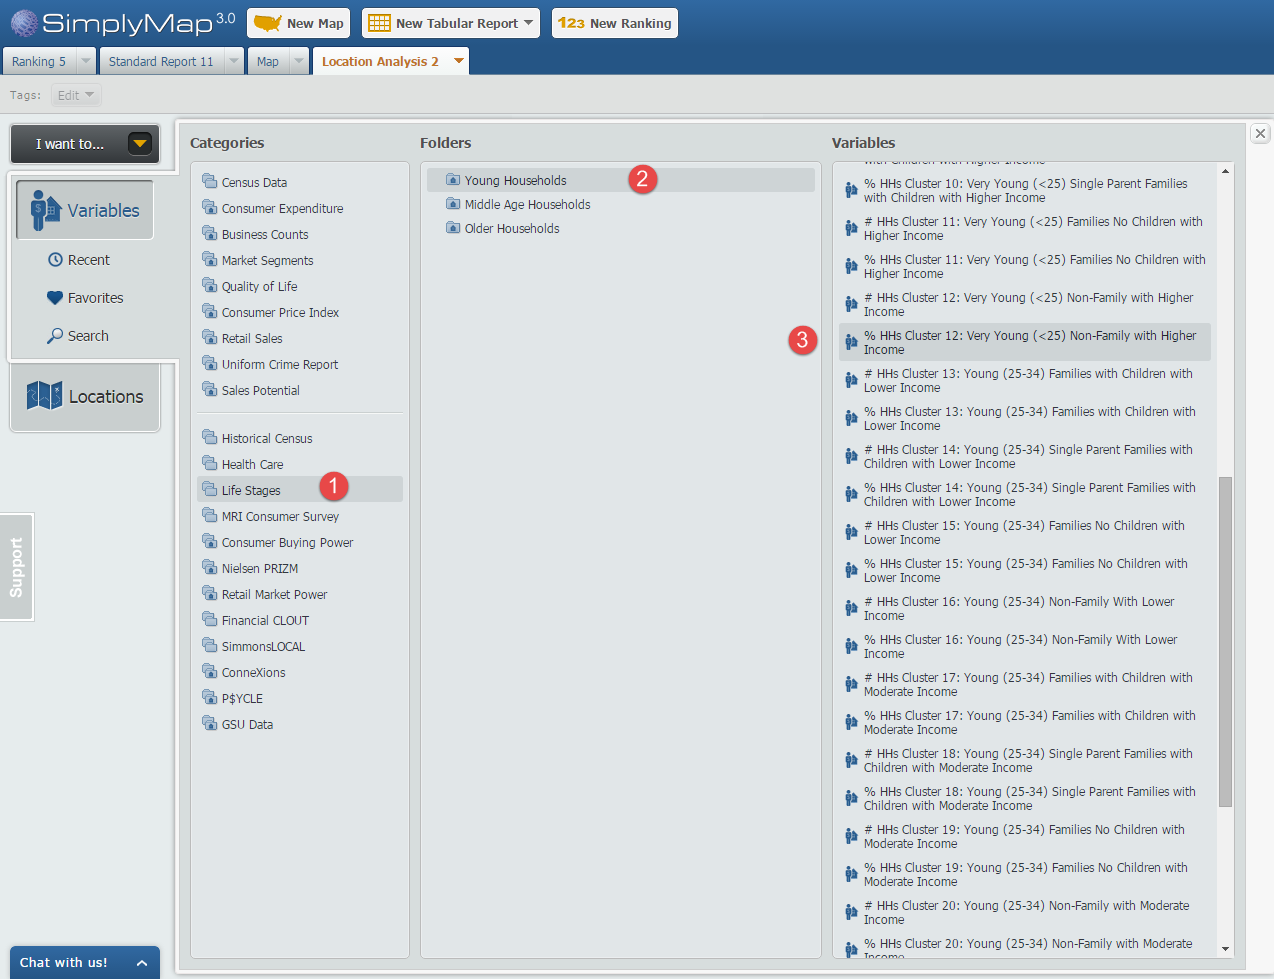
Step 2: Open the Variables Panel and navigate to Life Stages and through each household folder, selecting the variables that meet our criteria, such as: % HHs Cluster 12: Very Young (<25) Non-Family with Higher Income, 2014. Image below for reference.
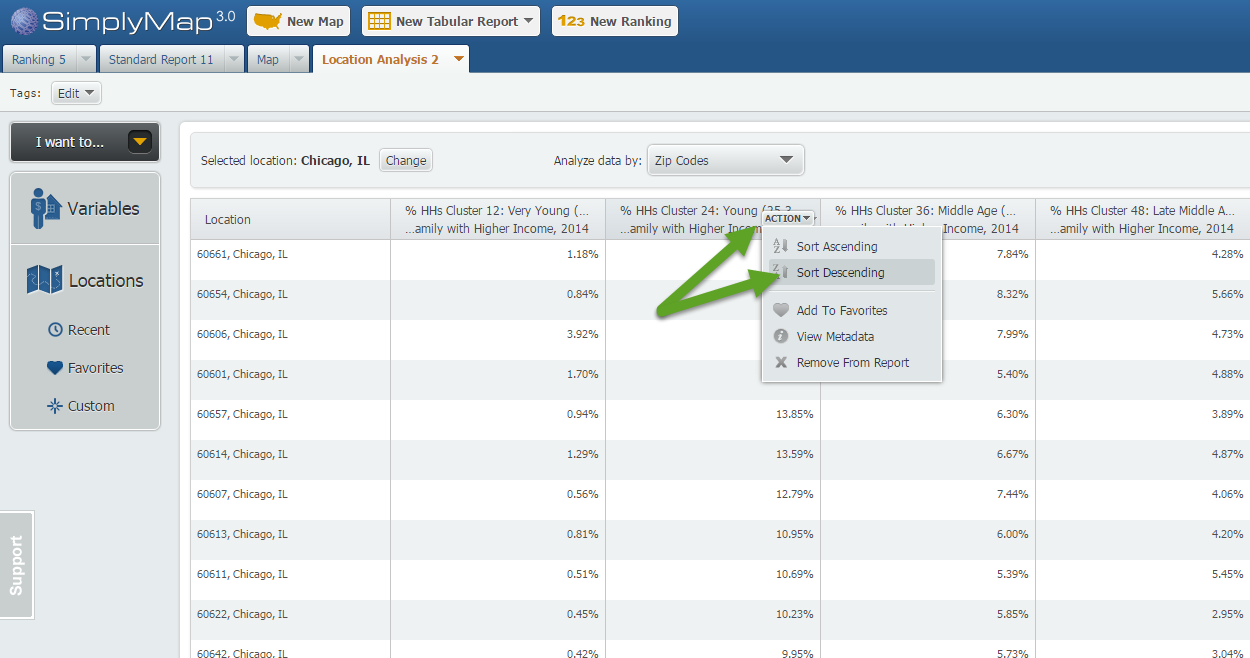
Step 3: Hover over each variable in your report and select “Sort Descending”. This will effectively rank your Chicago ZIP Codes by that variable allowing you to see the ZIP Codes where each selected variable is most represented.
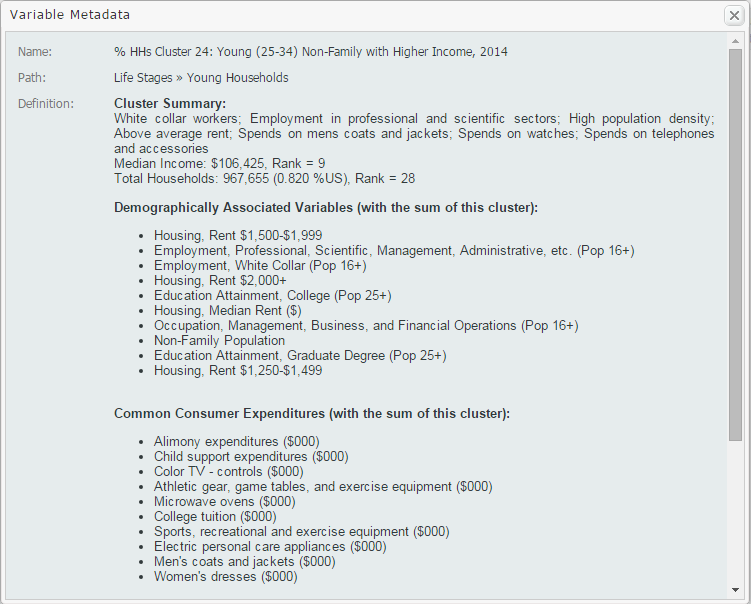
Tip: To gather more information on your variables, such as a definition and summary, select View Metadata from the dropdown that appears when hovering over the variable. Sample shown below:
We hope you enjoyed this week’s feature on the Life Stages data module. If you feel this data package could be useful at your institution, send an email to support@geographicresearch.com We would be happy to set up a free temporary trial.
Stay tuned for more!
More from SimplyAnalytics
Posted on Jan 10, 2024 by Admin
We are delighted to announce our sponsorship of the Midwest Entrepreneurship Case Competition! At SimplyAnalytics, we understand the power of data-driven decision-making in entrepreneursh...
Posted on Jan 18, 2008 by Admin
The BRASS Business Reference Sources Committee of Reference & User Services Quarterly (RUSA) selected SimplyMap as one of the Outstanding Business Reference Sources for 2007. Excerpt...
Posted on Mar 13, 2023 by Admin
Hello readers! Today, we’re excited to officially introduce the Location Query Report in SimplyAnalytics. The Location Query Report is a powerful feature in SimplyAnalytics that allows us...
Posted on Jun 02, 2017 by Admin
We can't wait for ALA Annual this Summer, and the opportunity to share SimplyAnalytics with the ALA community. Stop by the SimplyAnalytics booth (1339) and take a peak at what we've been ...
Posted on Sep 05, 2019 by Admin
SimplyAnalytics will be exhibiting at the biennial North Carolina Library Association conference, to be held this year at the Winston-Salem Benton Convention Center. If you are attending,...
Posted on Oct 23, 2009 by Admin
SimplyMap was highlighted in the Wake County, NC Public Library Business Blog today as a valuable tool for business planning. Wake County has access to SimplyMap through NC LIVE, a statew...
Posted on Feb 02, 2024 by Admin
We are excited to be back exhibiting at PLA this April in Columbus, OH. Join us at Booth #2631 to discover how SimplyAnalytics can help libraries understand their service area, assist sma...
Posted on Apr 27, 2015 by Admin
In this week’s write up we want to share some quick tips and tricks that you might not yet know about in SimplyMap. TIP #1 Did you know that you can share your work? SimplyMap allows you ...
Posted on Mar 02, 2018 by Admin
In this week’s blog we’ll take a look at how to enter an address in SimplyAnalytics to find the Census Block Group or Census Tract. Let’s get started! Use Case: You want to analyze the ar...
Posted on Feb 25, 2020 by Admin
SimplyAnalytics will be exhibiting at the PLA Conference, held this year at the Music City Center in Nashville, TN on February 26 - 28. Visit the team at Booth 1444 with your questions, f...