


Exploring SimplyMap Data: America’s Favorite Music
Posted on Sep 09, 2015 by Admin
This week’s SimplyMap report will set out to discover what America’s favorite type of music is. We will use data within the premium data package, SimmonsLOCAL to answer the question. The process outlined below can be completed within a matter of minutes - let’s get started!
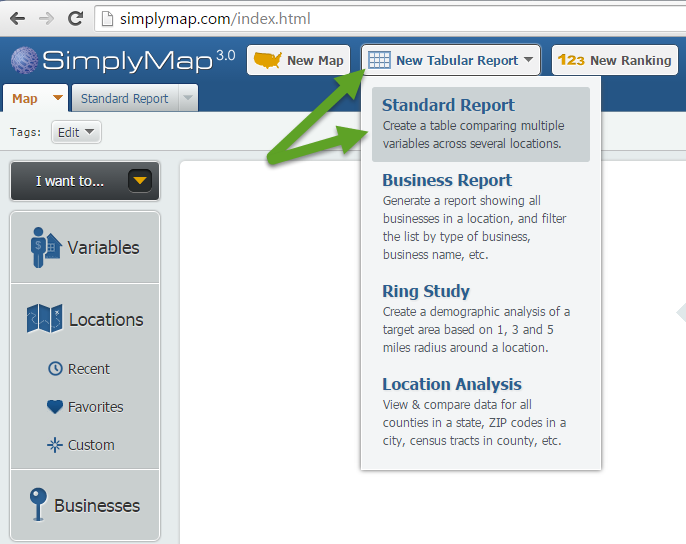
First, create a new Standard Report.
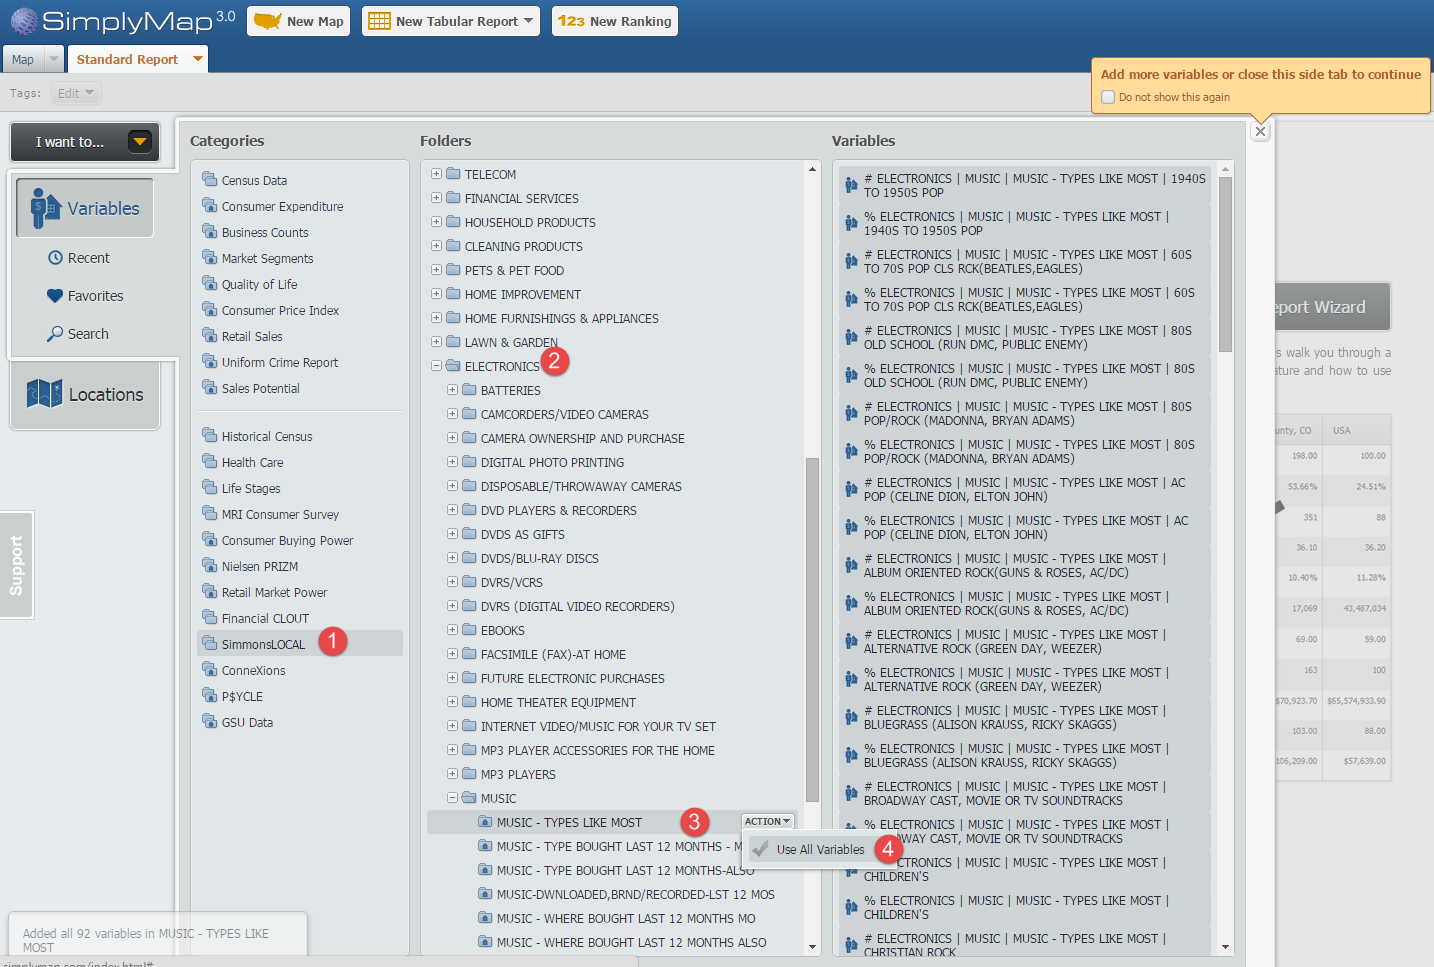
Next, locate the folder MUSIC - TYPES LIKE MOST. When you hover over this folder, use the option to Use All Variables from the action menu. Picture below for reference.
Close out the Variables panel to generate your report. Lastly, Sort Descending to see the highest totals represented up top. To do so, hover over the USA and select Sort Descending from the dropdown menu:
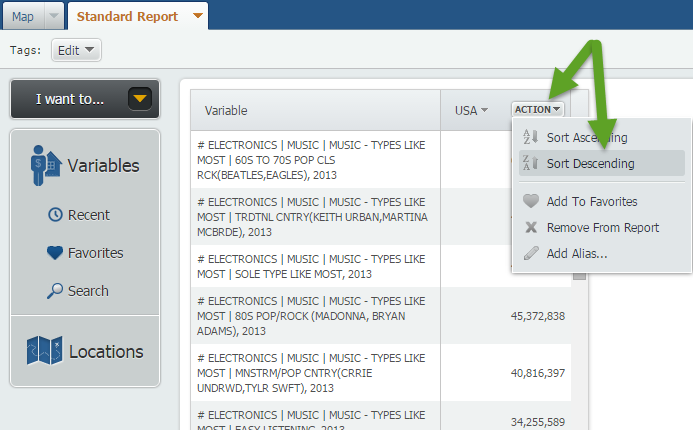
So what is America’s favorite type of music? According to our data, America’s favorite type of music is 60s and 70s Pop Classic Rock, featuring bands such as The Beatles and The Eagles! A distant second is Traditional Country featuring artists such as Keith Urban and Martina McBride.
For fun, let’s add a few other places and repeat the Sort Descending process.
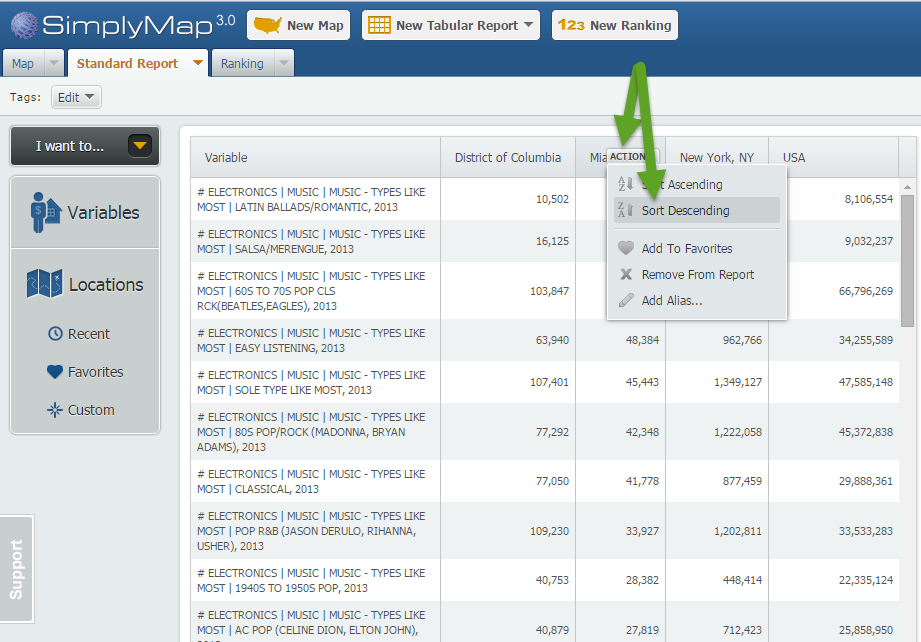
Washington D.C’s favorite music: Pop R&B (Jasun Derulo, Rhianna)
Miami’s favorite music: Latin Ballads followed closely by Salsa/Merengue
New York’s favorite music: 60s and 70s Pop Classic Rock
We hope you enjoyed exploring SimplyMap data with us this week. Stay tuned for more reports and tips!
More from SimplyAnalytics
Posted on Oct 02, 2015 by Admin
In this week’s SimplyMap tip, we wanted to do a quick write up reminding users about the Saved Tabs feature within SimplyMap. Did you know that SimplyMap will automatically save all of yo...
Posted on Feb 17, 2015 by Admin
Our recent trip to Chicago exhibiting at the ALA Midwinter Meeting inspired this week’s SimplyMap blog post. Today, we’re going to demonstrate how to use business points in SimplyMap to a...
Posted on Feb 24, 2023 by Admin
We are excited to attend SCELCapalooza 2023, a three-day conference for academic and research librarians in Southern California. The Vendor Day showcase will take place on March 1st, 2023...
Posted on Jun 01, 2014 by Admin
Visit the SimplyMap team at the ALA Annual Conference and Exposition in Las Vegas later this month. We will be at booth 1271, offering product demonstrations, tips & tricks, and of co...
Posted on Jul 24, 2013 by Admin
Registration is now open for the North Carolina Library Association Conference! Visit us at the 60th biennial conference (Booth #45) through October 15 - 18, 2013. We have beautiful ca...
Posted on Jan 23, 2024 by Admin
We are excited to again make the trip to Los Angeles for SCELCapalooza 2024 hosted at Loyola Marymount University! Please drop by our table on Wednesday, Feb. 28th to learn more about Sim...
Posted on May 28, 2009 by Admin
The Charleston Advisor, which publishes critical reviews of online resources for libraries, published a review of SimplyMap in April. We are very pleased to have received 4 1/4 stars out...
Posted on Nov 23, 2012 by Admin
Men's Health magazine is charting vanity in US cities, with help from SimplyMap. What did they find? The Sunshine State, with a long history of going to great lengths to look good, tops t...
Posted on Jan 29, 2016 by Admin
In a previous blog entry, we highlighted the benefits of having multiple years of data available for the same variable. This allows users to identify trends over time. Keeping with the sa...
Posted on May 15, 2015 by Admin
In this week’s SimplyMap report, we want to share with you the many options available when exporting maps in SimplyMap. In SimplyMap, when a user selects Export Map Image from the Actions...