


COVID-19 Data is Now Available in SimplyAnalytics
Posted on Apr 07, 2020 by Admin
As COVID-19 spreads across the United States researchers need access to the latest data visualization and analytics tools. As a result, the SimplyAnalytics team just added COVID-19 data at the national, state, and county levels to SimplyAnalytics. The data is from USAFacts.org and we update it daily with the latest numbers.
The following data variables are now available in SimplyAnalytics:
- Confirmed COVID-19 Cases by date
- Prevalence of confirmed COVID-19 cases (per 100,000 individuals) by date
- Deaths from COVID-19 by date
- Prevalence of deaths from COVID-19 (per 100,000 individuals) by date
You can find the COVID-19 data in SimplyAnalytics in two places:
- [recommended] Go to the Data tab, click on the "Data Folder" view (located just below the data search box), then scroll to the bottom of the list of data folders, or
- Go to the Data tab, click on the Health category icon, then check the box next to COVID-19 in the list of health sub-categories
This data can be combined with our demographic and health data variables to identify areas with vulnerable residents, such as the elderly, people with respiratory illnesses, and smokers.
Here are the best ways to view this data in SimplyAnalytics:
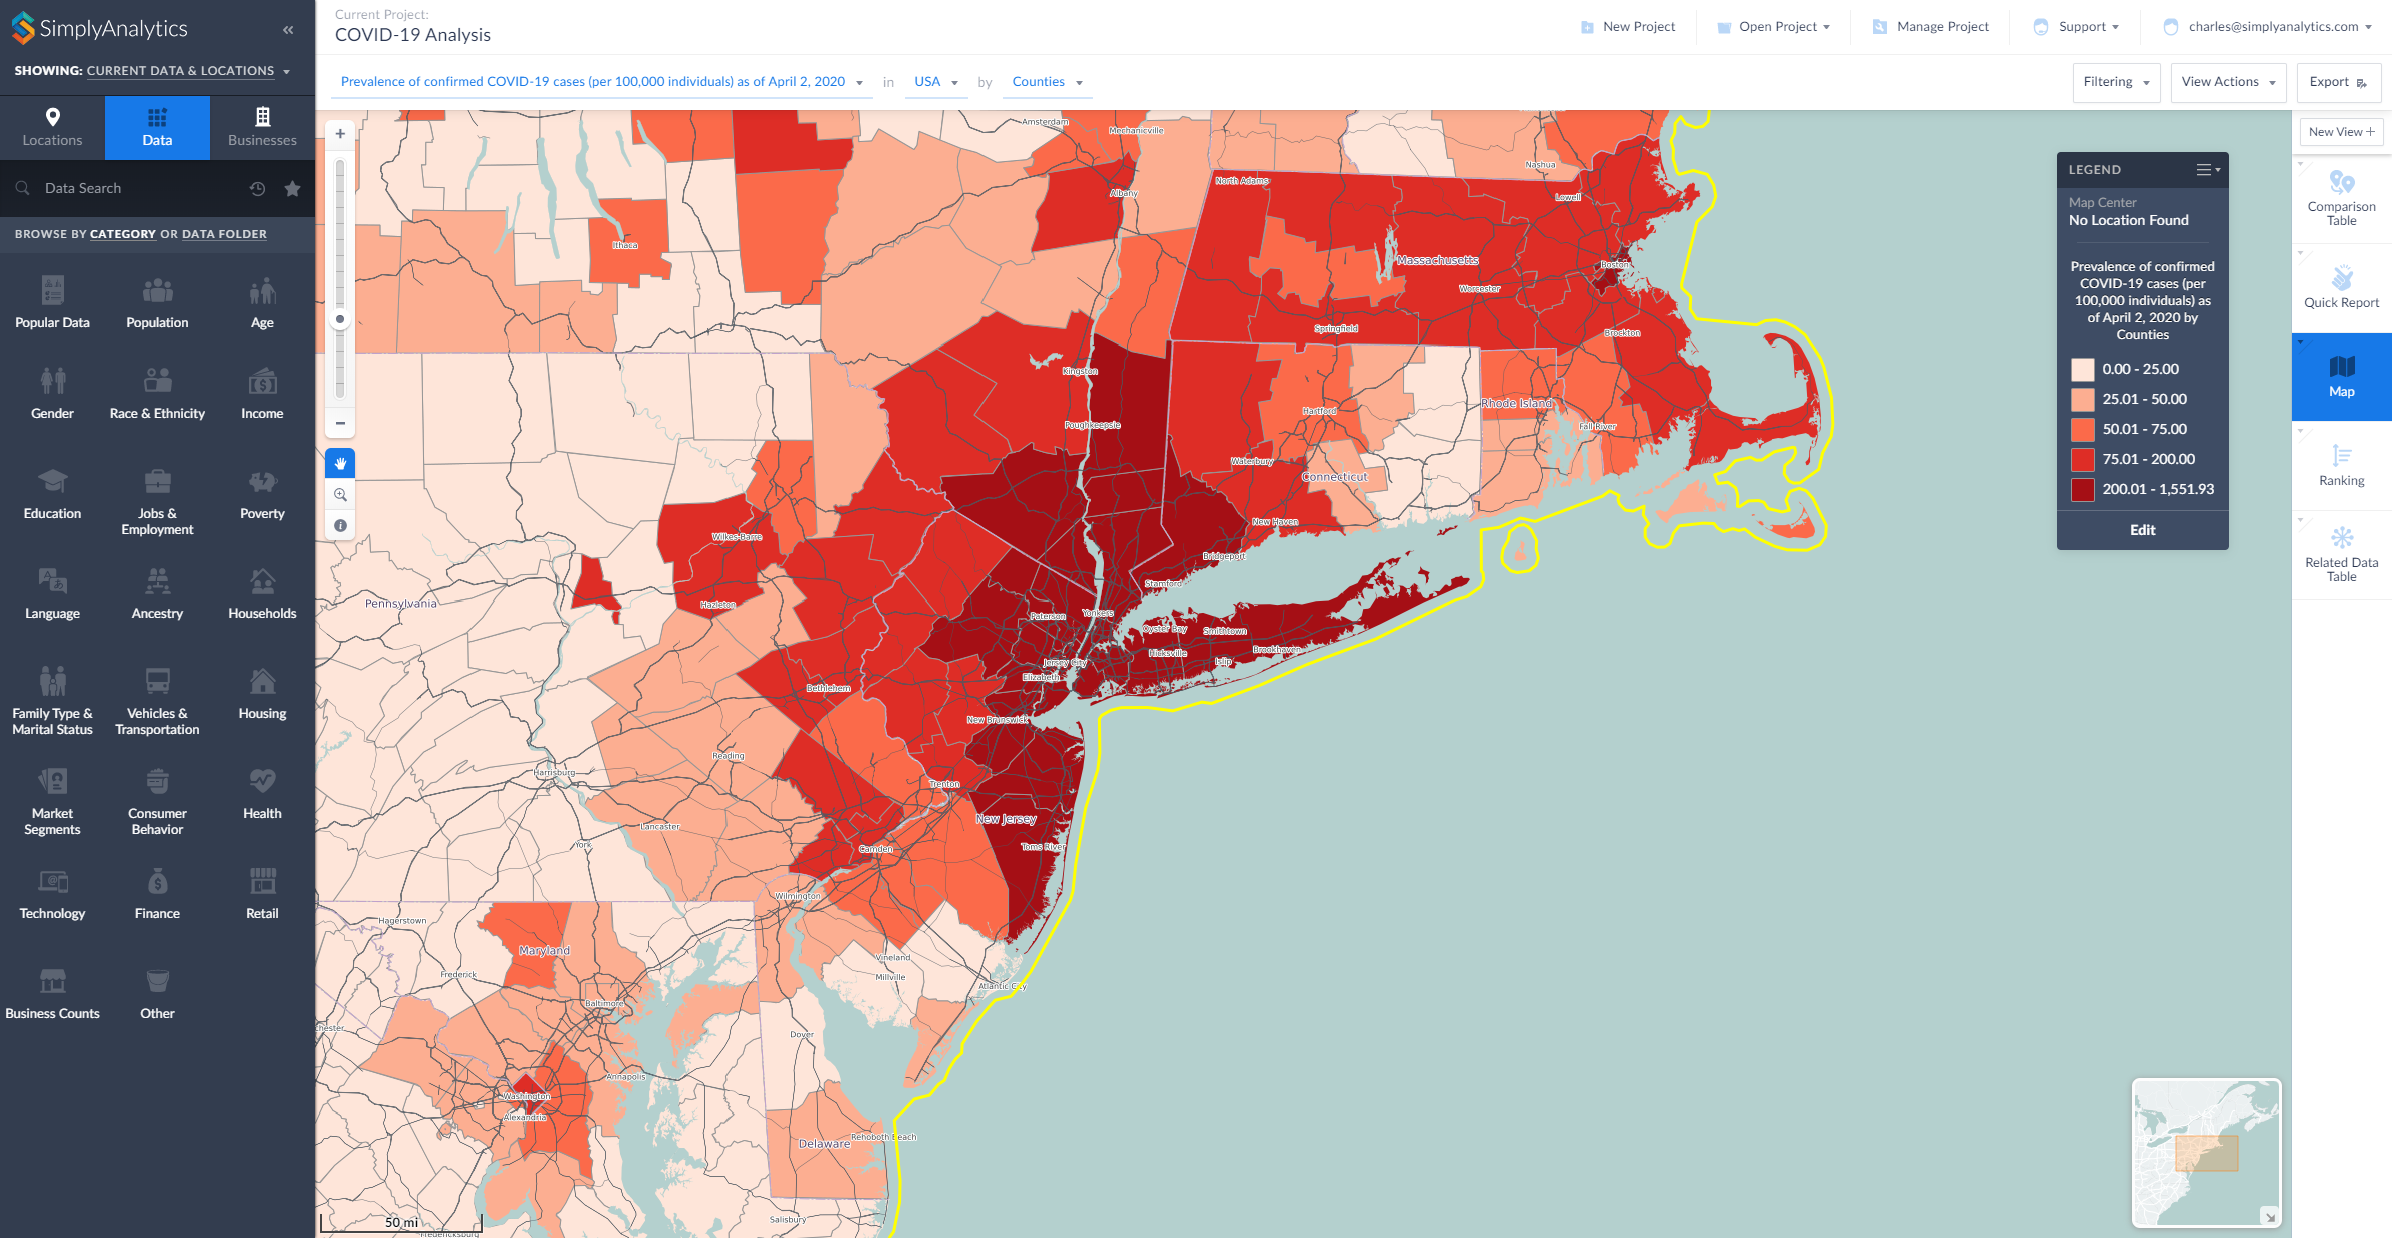
- Map View: map the COVID-19 data by County or State
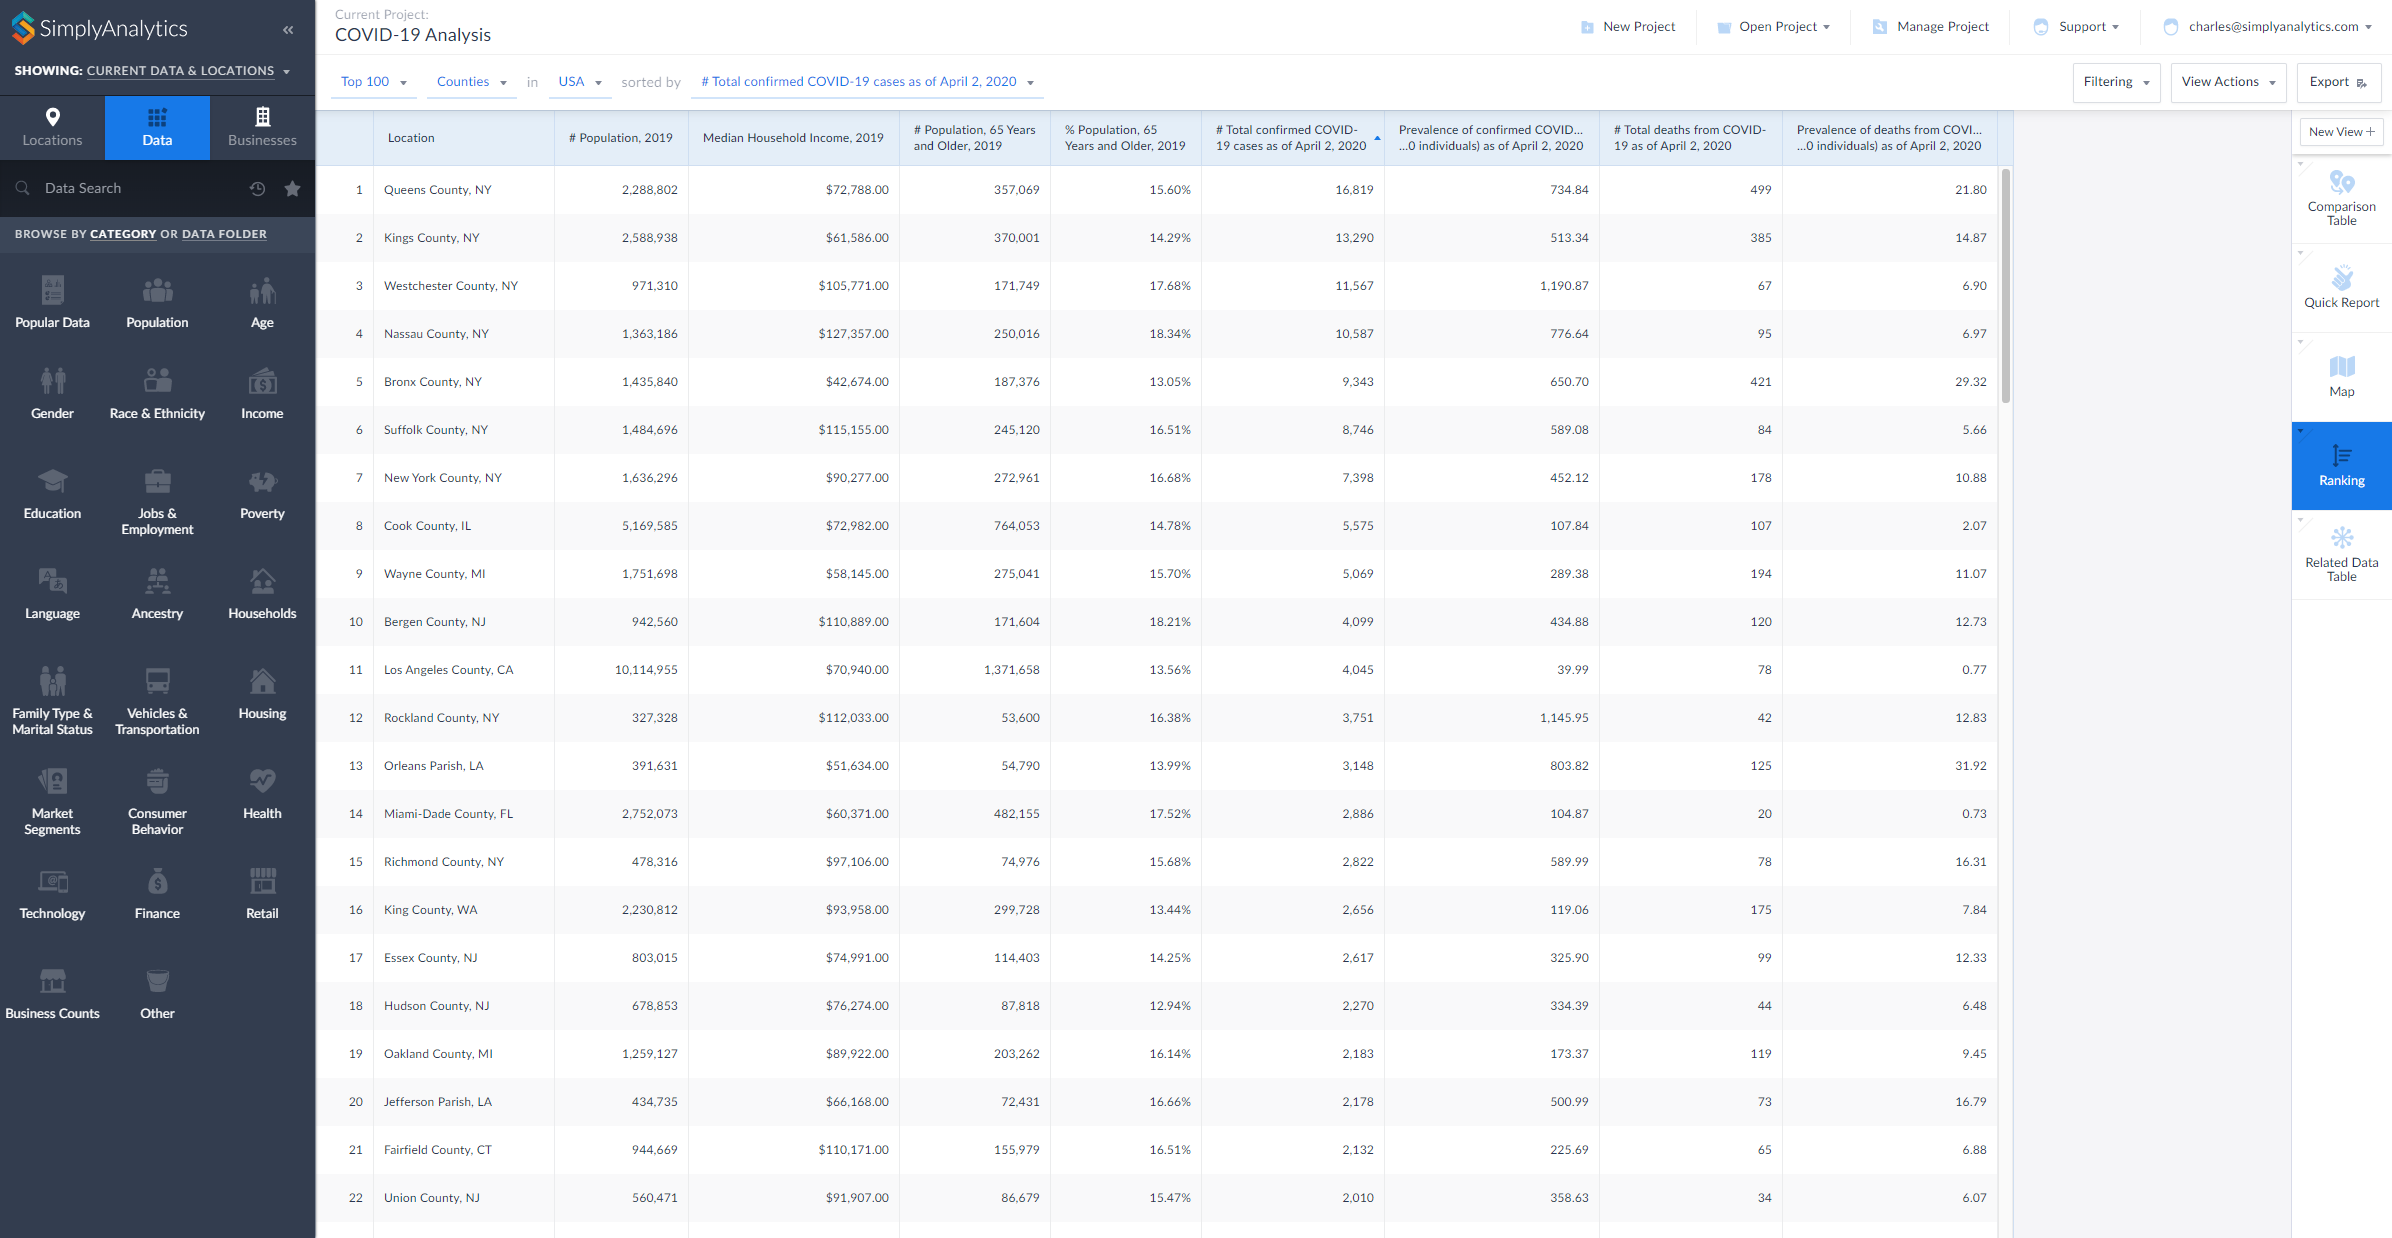
- Ranking View: rank all counties in the United States to identify areas with the highest counts or rates of COVID-19
- Comparison Table View: add your counties and states and any COVID-19 variables to this report to compare rates over time
- Related Data Table View: add one variable from a folder to this view and all of the rest will be added automatically
Here are two examples showing the data being used in SimplyAnalytics, a map and a ranking (click to enlarge):
During this difficult time we are committed to providing remote access and high quality customer support to all of our users who are now working remotely. Please contact us at support@simplyanalytics.com if you have any questions.
More from SimplyAnalytics
Posted on Oct 07, 2013 by Admin
Do you know the quickest way to find the name of a Block Group, Census Tract or ZIP code in our upcoming release for 3.0? The i-Tool gives you the ability to click anywhere on a map to g...
Posted on Oct 26, 2016 by Admin
In this week’s SimplyMap report, we’ll take a look at the tags feature and demonstrate how it can be useful for you as you work in SimplyMap. SimplyMap users can have up to 20 tabs open i...
Posted on Oct 12, 2010 by Admin
NC LIVE, a member-driven library service organization dedicated to providing online information services that support education, enhance statewide economic development, and increase qu...
Posted on Mar 02, 2018 by Admin
In this week’s blog we’ll take a look at how to enter an address in SimplyAnalytics to find the Census Block Group or Census Tract. Let’s get started! Use Case: You want to analyze the ar...
Posted on Jun 02, 2017 by Admin
We can't wait for ALA Annual this Summer, and the opportunity to share SimplyAnalytics with the ALA community. Stop by the SimplyAnalytics booth (1339) and take a peak at what we've been ...
Posted on Sep 01, 2008 by Admin
The King County Library System in Washington State now subscribes to SimplyMap, and has published a brief review on their blog, Library Talk.
Posted on Jun 09, 2021 by Admin
Hello readers! SimplyAnalytics will be exhibiting at the Virtual ALA Annual Conference this year on June 23-26. Be sure to drop by our booth, and click the banner image to video chat with...
Posted on Mar 04, 2014 by Admin
March 11-15 Indianapolis, Indiana The Public Library Association is prepared for another week of events, workshops and special appearances for librarians and authors. Visit our exh...
Posted on Feb 14, 2017 by Admin
In previous blog entries, we highlighted the value of having a mapping application to complement premium data when analyzing America's geographic preferences in credit cards, and mayonnai...
Posted on Dec 03, 2015 by Admin
With the Thanksgiving holiday last week, we decided to take a quick look into SimplyMap to see what pertinent variables are available for analysis. First, open the Variables panel and cli...