 Go up
Go up


SimplyMap Tip - Using Tags
Posted on Oct 26, 2016 by Admin
In this week’s SimplyMap report, we’ll take a look at the tags feature and demonstrate how it can be useful for you as you work in SimplyMap. SimplyMap users can have up to 20 tabs open in SimplyMap, each with a different map or report. As you progress and generate more tabs, it becomes useful to organize your work. This is where the tags feature comes in handy.
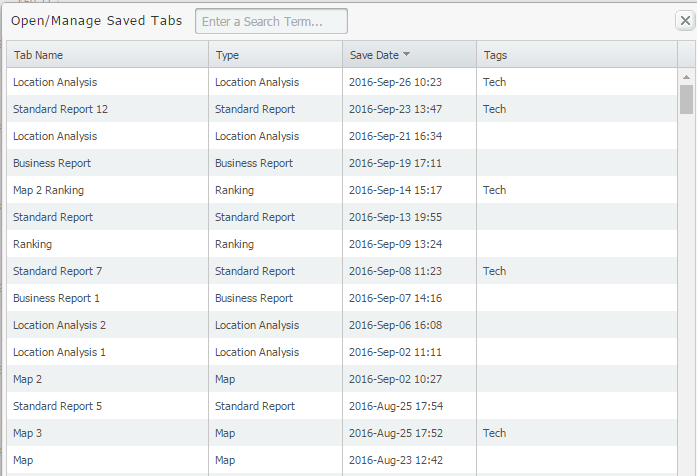
Let’s say for example that you want to revert back to some tabs mapping technology adoption data that you previously closed out. If you didn’t tag your work, and did not name the tab, the task of finding the right tab can become tedious. Your saved tabs list looks something like this:
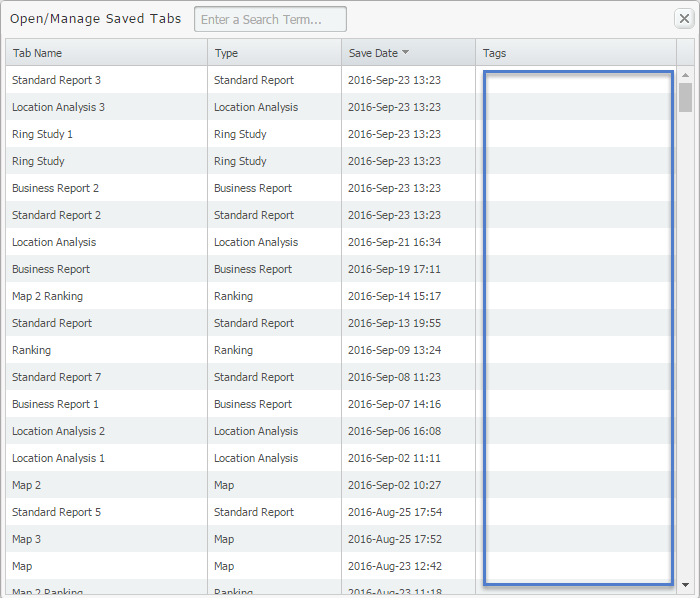
If tags are assigned, you can search by keyword and identify the tab you are looking for quickly. Applying tags to your work is simple, here’s what to do:
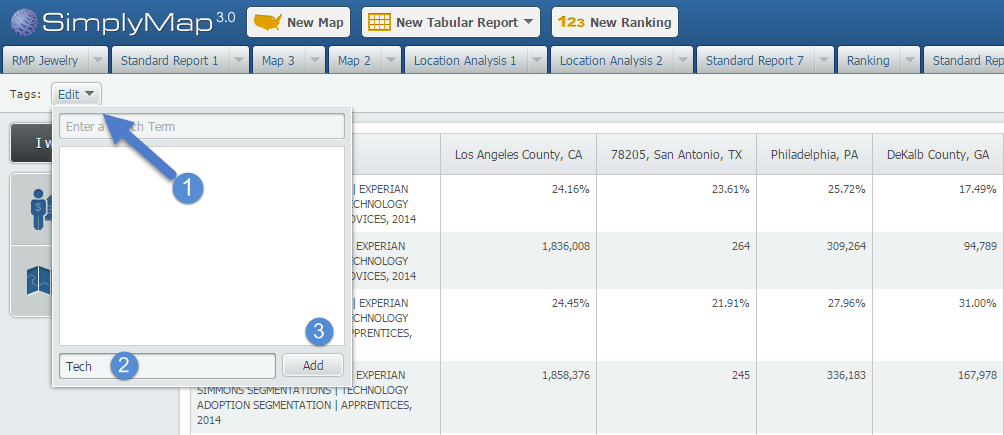
Select the Edit drop down menu located towards the top-left of your report (1), enter a tag in the available textbox (2), and then Add (3). See image below:
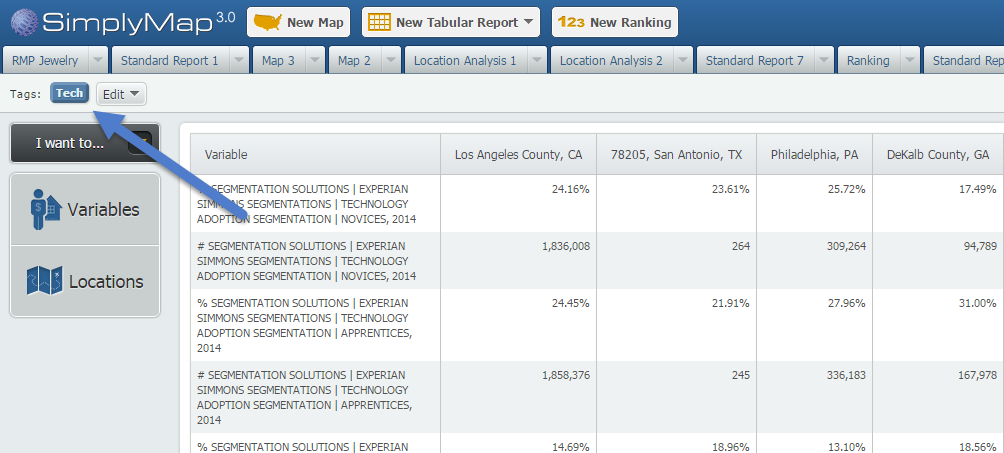
Once added, you’ll see a tag added by that option:
To assign the “Tech” tag to other tabs in SimplyMap, open the tab and select “Tech” from the available tags:
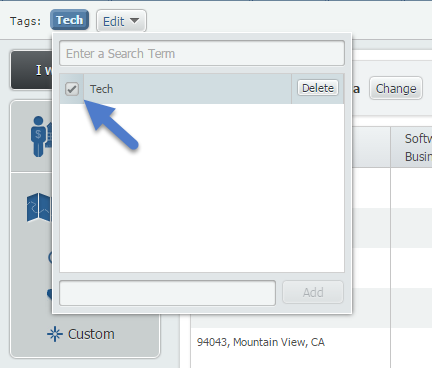
When you go back to your saved/managed tabs list, you be able to see or quickly search for all maps and reports related to Tech.
Stay tuned for more SimplyMap tips!
More from SimplyAnalytics


Posted on Jun 08, 2023 by Admin
We are excited to announce Mansi Nishit Trivedi as the winner of the 2023 BRASS Student Travel Award sponsored by SimplyAnalytics! Mansi, a Master of Information student at Dalhousie, has...
Posted on Dec 02, 2019 by Admin
Hi everybody! We’re back this week with another question from our Help Desk. This time featuring SimplyAnalytics Canada. Let’s get started! Question: How can I analyze all of the PRIZM5 s...
Posted on Oct 07, 2024 by Admin
We're headed to Charleston! Come visit the SimplyAnalytics team on November 12th at the Gaillard Center at booth 41. We'll be doing live demonstrations of the database, answering question...
Posted on Jan 15, 2013 by Admin
The GRI team is looking forward to exhibiting at ACRL 2013 at the Indiana Convention Center in Indianapolis April 10 - 12, 2013. Every other year, ACRL offers its premier professional dev...
Posted on Jul 20, 2020 by Admin
Hello readers! We hope you are doing well and staying safe. Today we are excited to introduce the Simmons NCS crosstabs functionality! This is a feature we’ve been working on for a while,...
Posted on Oct 08, 2019 by Admin
Hello readers! This week’s “From the Help Desk” is short & sweet. Let’s get to it! Question: How do I analyze all of the states at once in a report? Answer: The Ranking Report allows ...
Posted on Apr 10, 2015 by Admin
In this week’s SimplyMap report, we explore one of the newer datasets available: Retail Market Power®. What is it? In short, the Retail Market Power® dataset helps users identify opportun...
Posted on Oct 24, 2019 by Admin
Hi everybody! This week we wanted to bring you something unique, so we’re taking you behind the scenes to show you what goes in to setting up the SimplyAnalytics conference booth you’ve c...
Posted on Jun 07, 2011 by Admin
We will be exhibiting at the Special Library Association Annual Conference in Philadelphia and the American Library Association conference in New Orleans later this month. Come and visit ...
Posted on Apr 07, 2020 by Admin
As COVID-19 spreads across the United States researchers need access to the latest data visualization and analytics tools. As a result, the SimplyAnalytics team just added COVID-19 data ...