


SimplyMap Tip – Creating a Map from a Ranking Report
Posted on Nov 17, 2014 by Admin
Our recent series Exploring SimplyMap Data Reports has focused on creating ranking reports for unique variables. Accordingly, we thought it would be helpful to write a quick tip on how to create a map directly from the ranking results.
After creating a ranking report in SimplyMap, you can quickly create a map using any of the locations in your ranking. Let’s look at an example.
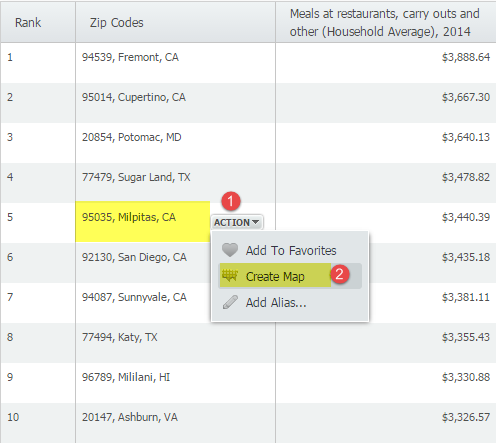
Our November 6 Report, “Which US Locations Dine Out the Most?” identified ZIP code 95035 in Milpitas, CA as the ZIP Code with the highest average spending on restaurant and carry out meals. We can find out exactly where it is located by mapping the location directly from the report by hovering over the location and selecting “Create Map” from the action dropdown, as shown below:
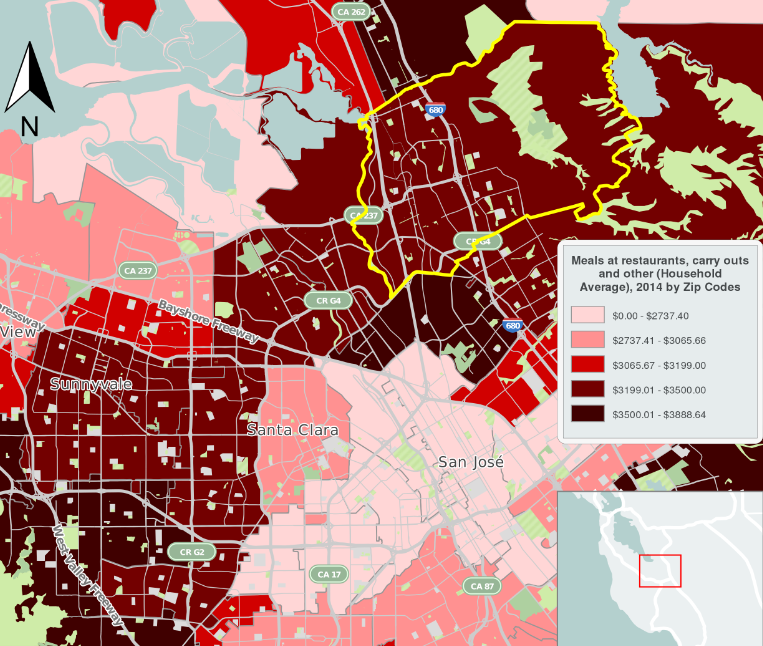
A map using the ranked variable (Meals at restaurants, carry outs and other (Household Average), 2014) will then be created. The image below shows an exported image of ZIP code 95035 in Milpitas, CA.
Stay tuned for more SimplyMap tips and tricks!
More from SimplyAnalytics
Posted on Apr 05, 2019 by Admin
Come visit the SimplyAnalytics booth (325) at the upcoming ACRL 2019 show in Cleveland! Say hello, grab a chocolate, and stay for a quick demo of SimplyAnalytics. The team will be showcas...
Posted on Feb 27, 2009 by Admin
Geographic Research, Inc. is pleased to participate in the Statewide California Electronic Library Consortium's (SCELC) 12th Annual Vendor Day. SCELC members and librarians from other aca...
Posted on Feb 13, 2015 by Admin
In this week’s report exploring SimplyMap data, we want to find out where America’s remote workers reside. To find this, we can tap into the Census data in SimplyMap. The specific variabl...
Posted on May 02, 2016 by Admin
Inspired by a recent support desk question, this week’s SimplyMap report will demonstrate how a user would run a business search that consists of multiple names. In short, the user was at...
Posted on Jul 30, 2008 by Admin
Cornell’s Albert R. Mann Library has subscribed to SimplyMap. They provide some tips and access to the SimplyMap Quick Reference Guide, variable list, and some information on the EASI dat...
Posted on Oct 08, 2008 by Admin
Geographic Research, Inc. (GRI) is pleased to sponsor the fourth annual American Collegiate Retailing Association’s Undergraduate Student Retail Analysis Competition. This is the second ...
Posted on Jun 01, 2014 by Admin
Visit the SimplyMap team at the ALA Annual Conference and Exposition in Las Vegas later this month. We will be at booth 1271, offering product demonstrations, tips & tricks, and of co...
Posted on Mar 11, 2024 by Admin
We're thrilled to announce that SimplyAnalytics will be exhibiting at the ALA Annual Conference in San Diego! We can't wait to connect with library professionals, share insights, and show...
Posted on Dec 07, 2011 by Admin
We will be exhibiting at the American Library Association Midwinter Meeting & Exhibition in Dallas this January. Visit us at booth 2513 for a demonstration and to have all your Simply...
Posted on Jan 29, 2016 by Admin
In a previous blog entry, we highlighted the benefits of having multiple years of data available for the same variable. This allows users to identify trends over time. Keeping with the sa...