


Identifying Top PRIZM Segments
Posted on Feb 27, 2015 by Admin
SimplyMap is an excellent tool for market research, and it’s made even more powerful by Nielsen PRIZM data. Nielsen PRIZM is the highest quality market segment data available. Every household in the United States is assigned to one of 66 segments, and Nielsen provides detailed information about each segment, such as demographic characteristics, shopping habits, financial and technology preferences, media habits, and much more.
PRIZM segments define every U.S. household in terms of 66 demographically and behaviorally distinct types, or "segments," to help marketers discern those consumers’ likes, dislikes, lifestyles and purchase behaviors. Used by thousands of marketers within Fortune 500 companies, PRIZM provides the "common language" for marketing in an increasingly diverse and complex American marketplace.
Let’s start by identifying the largest PRIZM segments in some target locations.
First, create a Standard Report using your target locations. We’ll compare some different ZIP codes within and including the city of Boston, MA. Next, navigate to the PRIZM segments. You will want to select each # segment within that folder. Lastly, close the window to generate your report.
To locate the highest segment within each location, hover over a location and select Sort Descending. SimplyMap will reprocess the report, showing the highest figure at the top for the selected location.
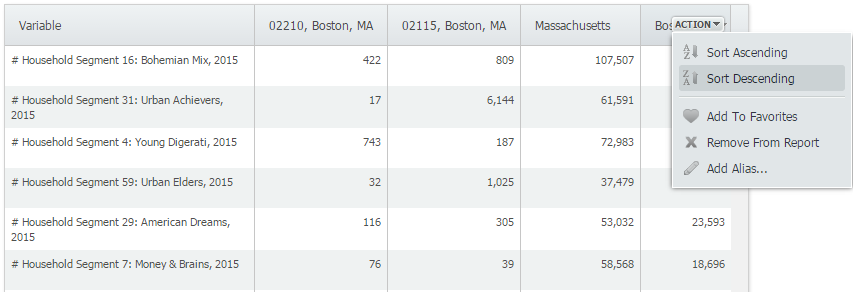 Here are the results for each ZIP code and the city of Boston.
02210: Young Digerati
02115: Urban Achievers
Boston: Bohemian Mix
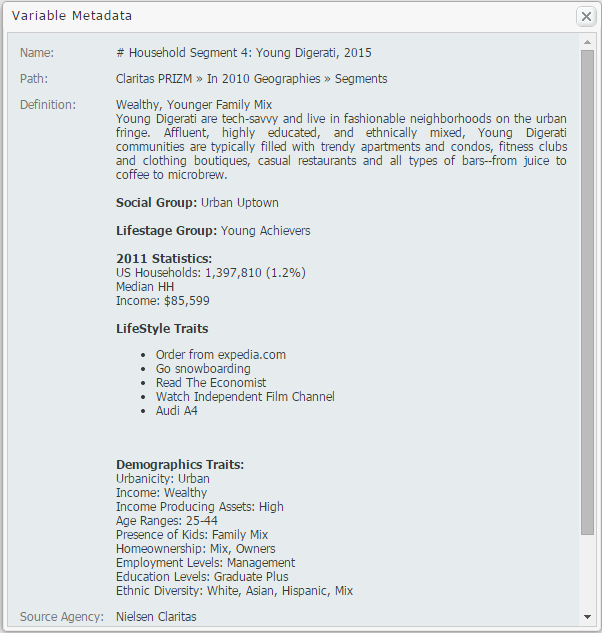
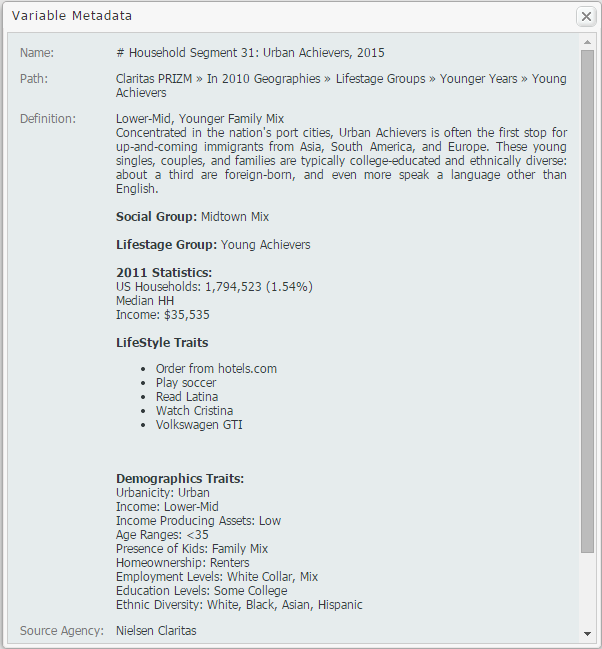
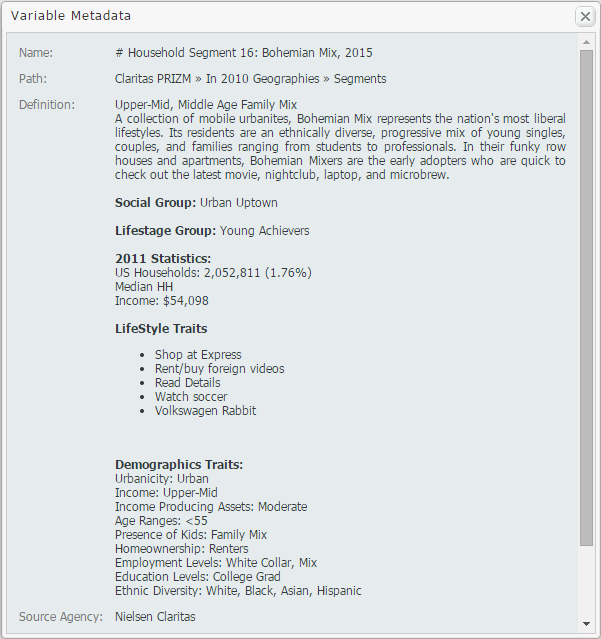
To find out more information about each segment, hover over the segment and select View Metadata. The metadata for each segment above is presented below:
ZIP Code 02210: Young Digerati
ZIP Code 02115: Urban Achievers
Boston, MA: Bohemian Mix Metadata
We hope you enjoyed this week’s blog. Stay tuned for more reports and SimplyMap tips! If you haven’t already, don’t forget to follow us on Twitter and Like Us on Facebook to get yourself entered into our Winter Sweepstakes!
More from SimplyAnalytics
Posted on Sep 21, 2009 by Admin
The North Carolina Library Association will hold its annual conference in Greenville, NC at the Greenville Convention Center from October 6-8, 2009. Geographic Research, Inc. will be exhi...
Posted on Apr 01, 2014 by Admin
Another fantastic series of workshops and events are planned at the SLA Conference on June 8-10th, 2014. Register now for networking and workshops throughout the week. Over 200 events are...
Posted on May 18, 2015 by Admin
The SimplyMap team is looking forward to visiting with customers and others at the SLA Annual Conference, coming to Boston on June 14-16. Come visit us at Booth #916, we are happy to answ...
Posted on Dec 07, 2011 by Admin
We will be exhibiting at the American Library Association Midwinter Meeting & Exhibition in Dallas this January. Visit us at booth 2513 for a demonstration and to have all your Simply...
Posted on Aug 27, 2018 by Admin
Welcome readers! This week we are excited to feature our newest view in SimplyAnalytics, the Time Series Table.What is it?The Time Series Table allows you to quickly pull all years availa...
Posted on Mar 18, 2015 by Admin
Can you guess which US city has the most residents per square mile? Today we’re going to use SimplyMap to answer this question for all cities, as well as cities with a population greater ...
Posted on Apr 23, 2018 by Admin
Hello everyone and welcome to this week’s blog. This week we will discuss how to create and utilize filters for your research. Why Use a Filter? Filters are a great way to identify target...
Posted on May 17, 2016 by Admin
This week’s SimplyMap report is a quick reader challenge. Can you guess what the map of the United States below is depicting? Keep in mind the legend colors - lighter is less, and darker ...
Posted on Feb 24, 2019 by Admin
We will be exhibiting at SCELC* Vendor Day on March 14th. Visit us at table 510 and attend one of our two sessions demonstrating SimplyAnalytics. The presentations will highlight newly av...
Posted on Jul 30, 2018 by Admin
Hello readers! Welcome to this week’s blog. This week we will feature the Related Data Table view and how you can use it to maximize your productivity in SimplyAnalytics. What is it? The ...