


Visualizing Brand Preference: Athletic Shoes
Posted on Feb 14, 2017 by Admin
In previous blog entries, we highlighted the value of having a mapping application to complement premium data when analyzing America's geographic preferences in credit cards, and mayonnaise brands. This week we’ll take a look at athletic shoe brand preference in the US for adults 18+.
Similar to the previous entries, we will use the SimmonsLOCAL data set to put these maps together. If your institution does not currently subscribe to the SimmonsLOCAL package, feel free to reach out to us about setting up a free 30-day trial. Let’s get started.
The maps below can each be generated in less than a minute! Open up the Variables panel, and find the variables in question at this path: SimmonsLOCAL » APPAREL » SHOES/ FOOTWEAR » SHOES/ FOOTWEAR - BRANDS.
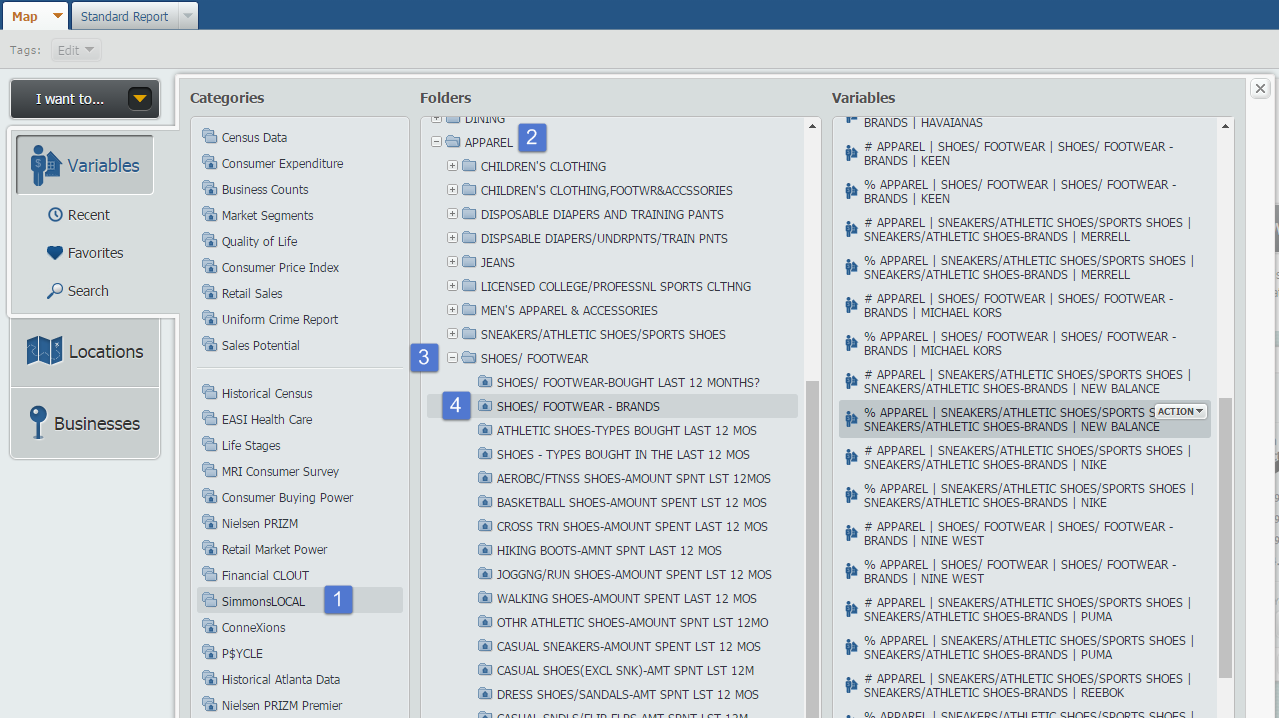
Click on the variable you are interested, and close out the panel to automatically generate a map of the United States. Results for 3 different brands below!
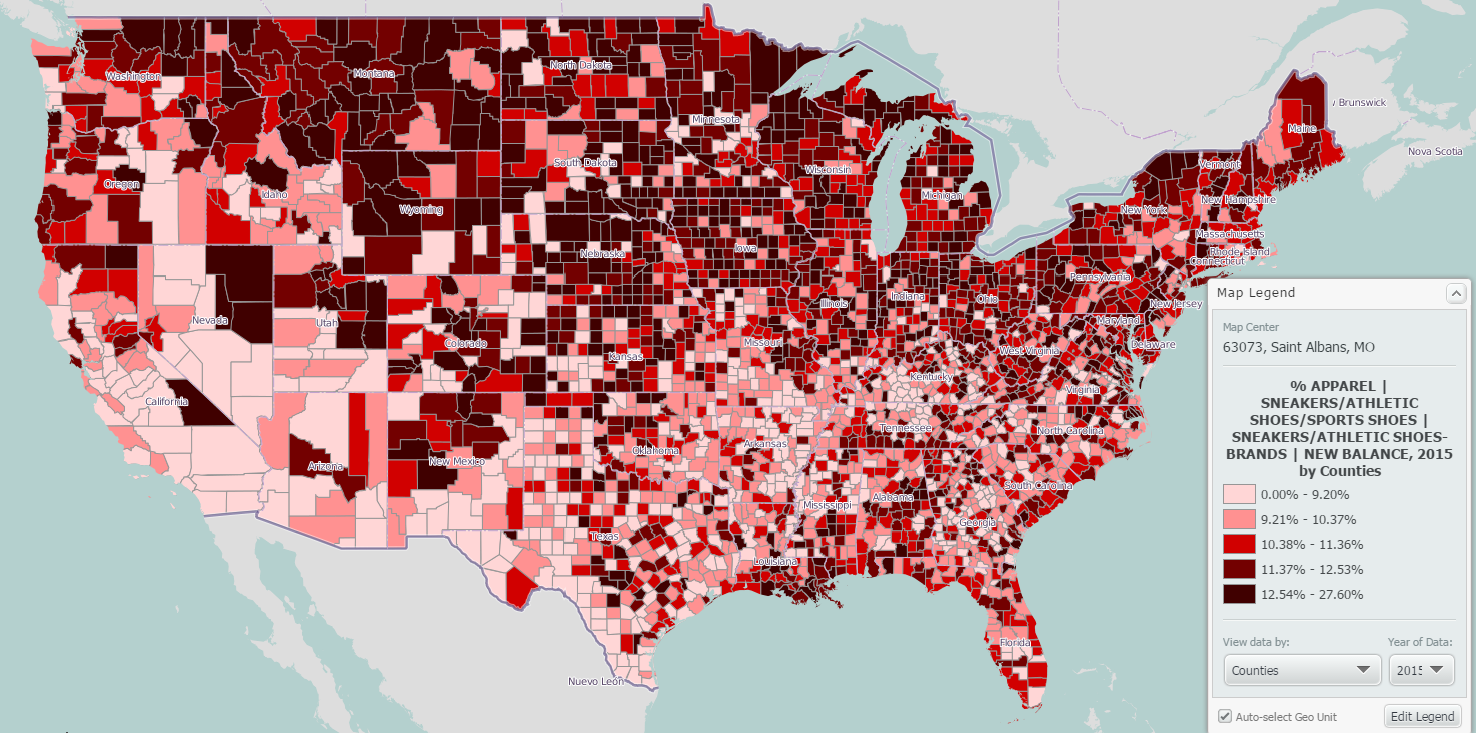
New Balance
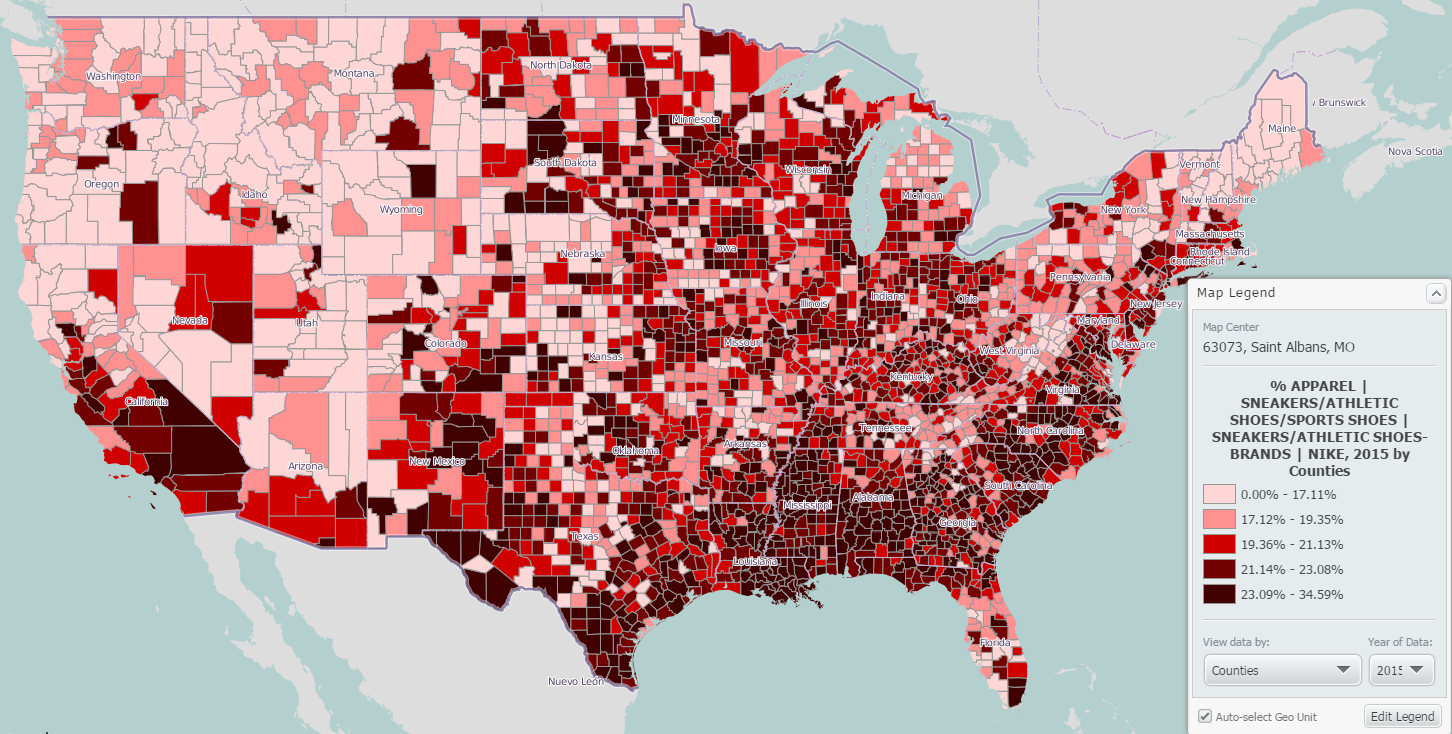
Nike
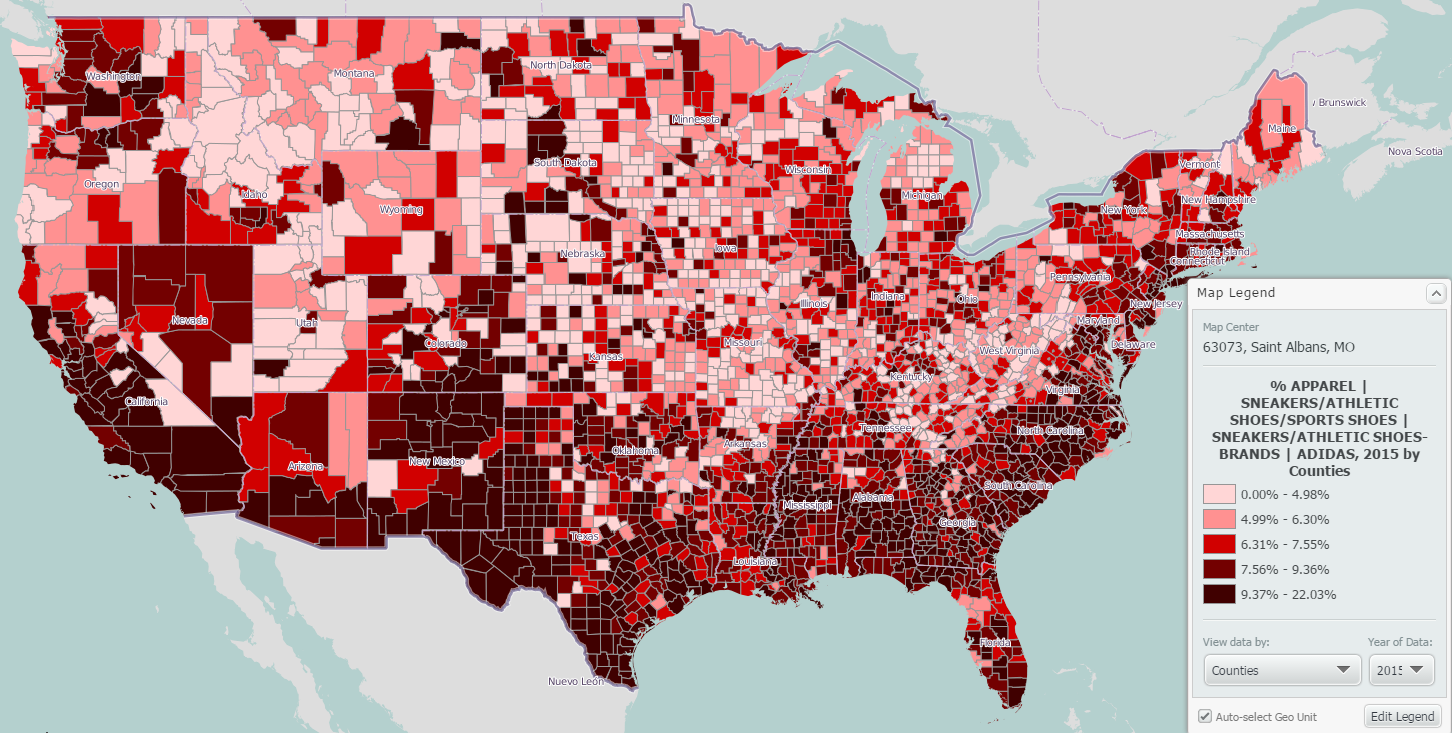
Adidas
A few interesting takeaways from these maps:
1. New Balance is popular amongst the northern half of the US
2. Folks in the south east love their Nikes
3. Adidas dominates the southern portion of the US, including the south west
Can you think of any other brands of items you would like to see mapped? The SimmonsLOCAL data set contains 8,000 specific brands, it is very possible that we have the data you are looking for. Let us know in the comments below!
More from SimplyAnalytics
Posted on Feb 13, 2015 by Admin
In this week’s report exploring SimplyMap data, we want to find out where America’s remote workers reside. To find this, we can tap into the Census data in SimplyMap. The specific variabl...
Posted on Feb 19, 2016 by Admin
Drop by booth #857 at PLA 2016 to meet the SimplyMap team and learn more about the features and functions behind SimplyMap. Have a Ghirardelli Chocolate while we present SimplyMap and off...
Posted on Aug 02, 2016 by Admin
Did you know that you can use SimplyMap to identify which make and model of vehicle is most prevalent within any location in the United States? In this week’s SimplyMap report, we’ll take...
Posted on Sep 10, 2019 by Admin
Hello readers! It’s been a minute since our last tutorial post, but you can expect to see more content on a weekly basis moving forward. “From the Help Desk” is a new feature on the blog ...
Posted on Feb 05, 2015 by Admin
In this week’s edition of exploring SimplyMap data, we take a look at America’s coffee drinkers. SimplyMap contains more than 100 coffee related variables, including consumer spending on ...
Posted on Oct 29, 2015 by Admin
Did you know that SimplyMap allows you to search for businesses by NAICS or SIC codes? Searching by these codes is a great alternative to the general keyword search. Using the keyword sea...
Posted on Jul 22, 2015 by Admin
In this week’s SimplyMap report, we take a look at one of our newly available data packages - ConneXions® from Nielsen. The ConneXions® segmentation system integrates consumer behavior an...
Posted on Oct 07, 2024 by Admin
We're headed to Charleston! Come visit the SimplyAnalytics team on November 12th at the Gaillard Center at booth 41. We'll be doing live demonstrations of the database, answering question...
Posted on Aug 26, 2015 by Admin
Most people in the United States could probably guess which cities are popular amongst tourists - Los Angeles and New York. But can you guess how much money is spent in novelty and souven...
Posted on Sep 28, 2018 by Admin
Welcome readers! Today we have a quick feature highlight that will assist you in browsing and searching for data variables. All data variables have a path where they reside within their d...