


Variable Menu Improvements & More
Posted on Dec 07, 2021 by Admin
Hello readers! We hope you are enjoying the holiday season as much as we are. Today, we are happy to announce a couple of improvements to SimplyAnalytics designed to help you get your research done more efficiently. Let’s check it out!
Variable Menu Changes
This first of two changes to the variable menus is rooted in customer suggestions that revolved around the same sort of question, namely: is there a way to quickly add in additional years or the # or % version of this variable? As of this week, the answer to this question is yes!
Now, when you are in a report and want to add in other years of data quickly, simply click on the variable name and refer to the Add Other Years text in the menu that displays.
In the example below, the chosen data variable is # Hispanic or Latino Population for the year 2021, but notice in the Add Other Years option, you are now welcome to instantly add in years from 2015, 2016, 2017, 2018, 2019, 2020, 2025 and 2026.
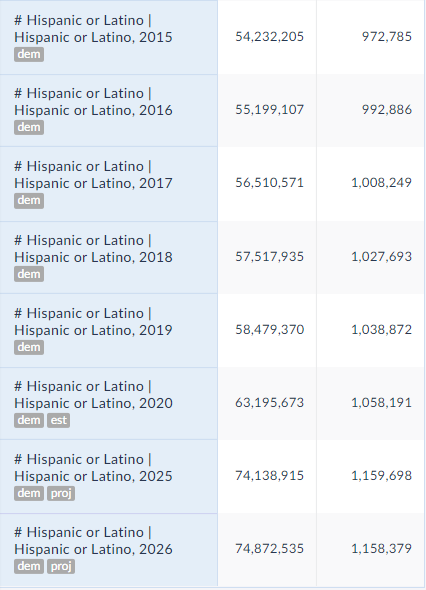
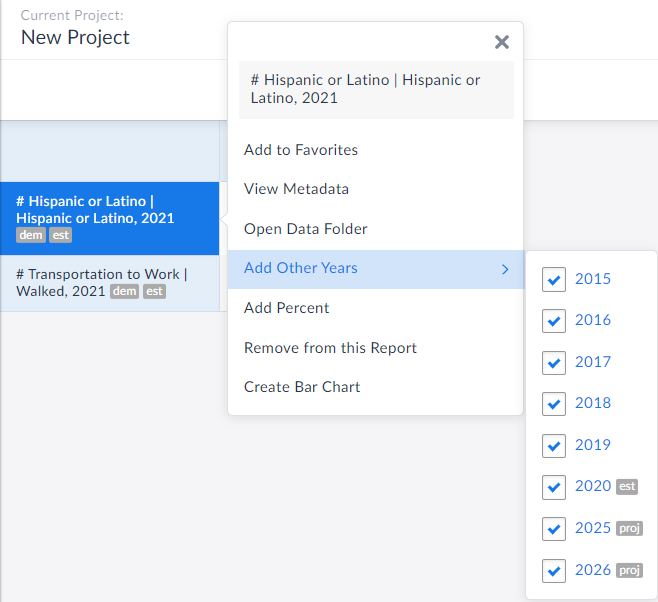 All you need to do is select the desired year(s), close out the menu/click away and voila! The new years are automatically added to your report:
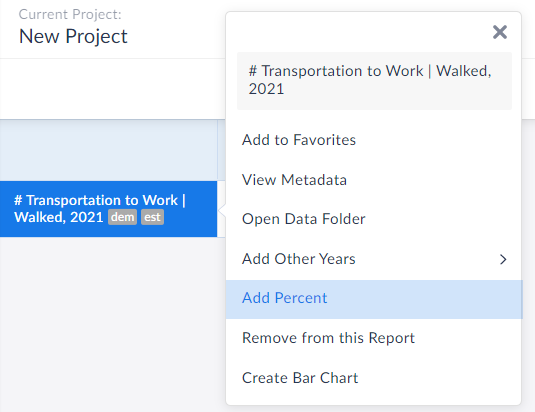
 Equally great is that users now have the ability to add in the other variation of your presently selected variable. For example, if you have # of adults walking to work in your report, you can immediately add in the % variation. This is also available from within the variable menu.
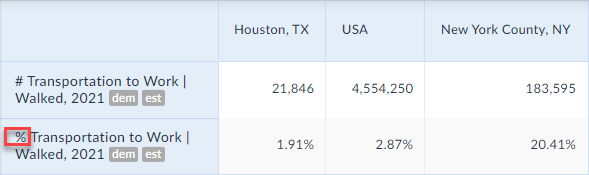
 The percent version is now added to your report:
 Create Data Table from Visualizations
We also wanted to update readers on this wonderful new feature that has flown under the radar, but is extremely useful.
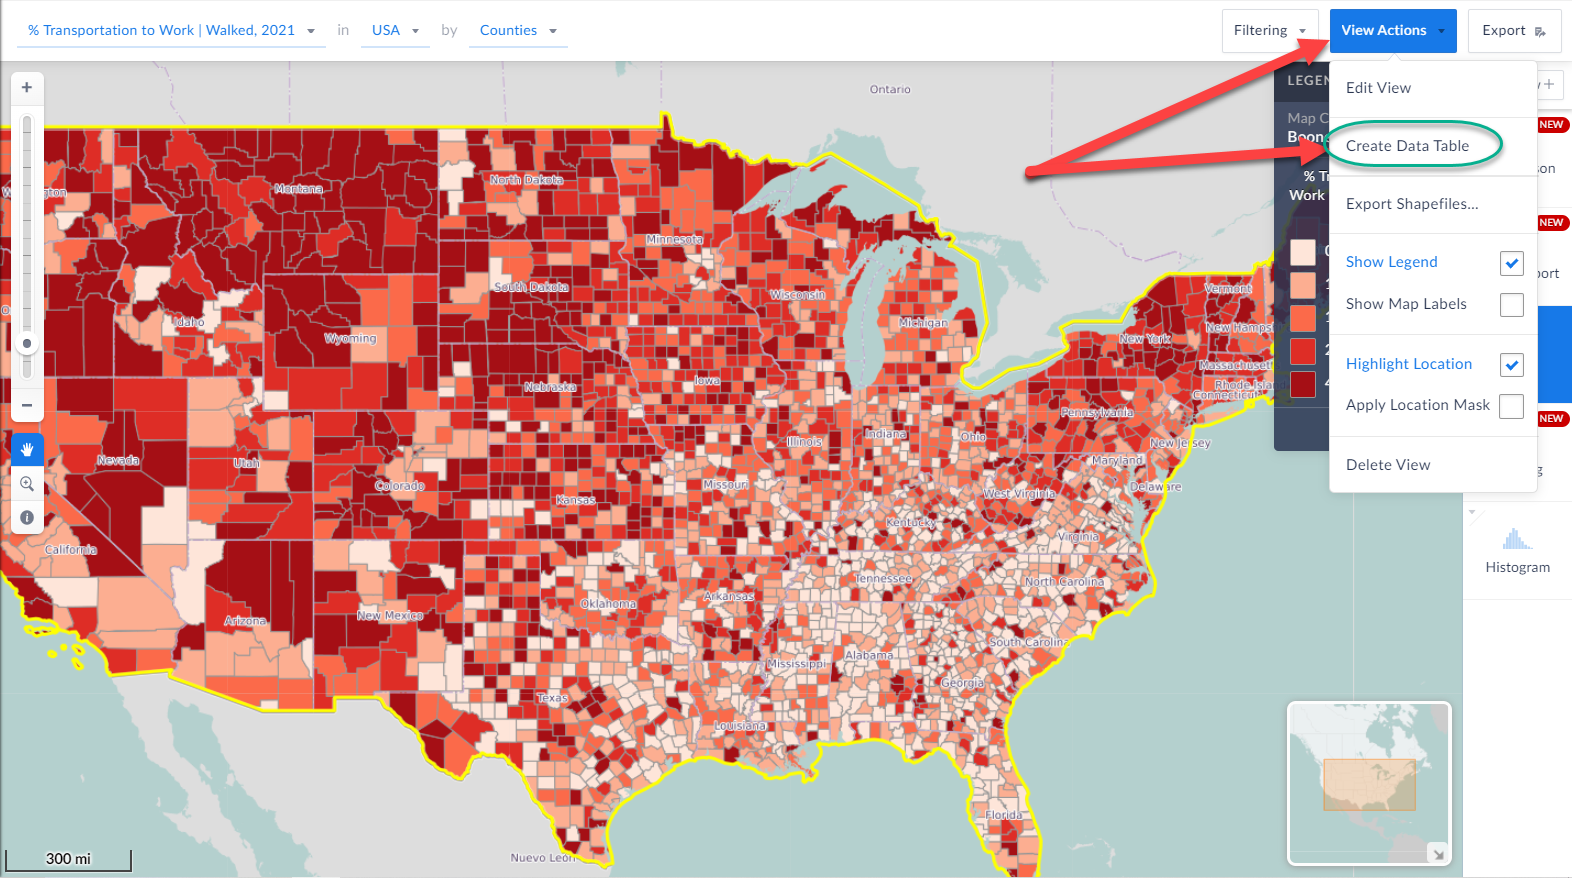
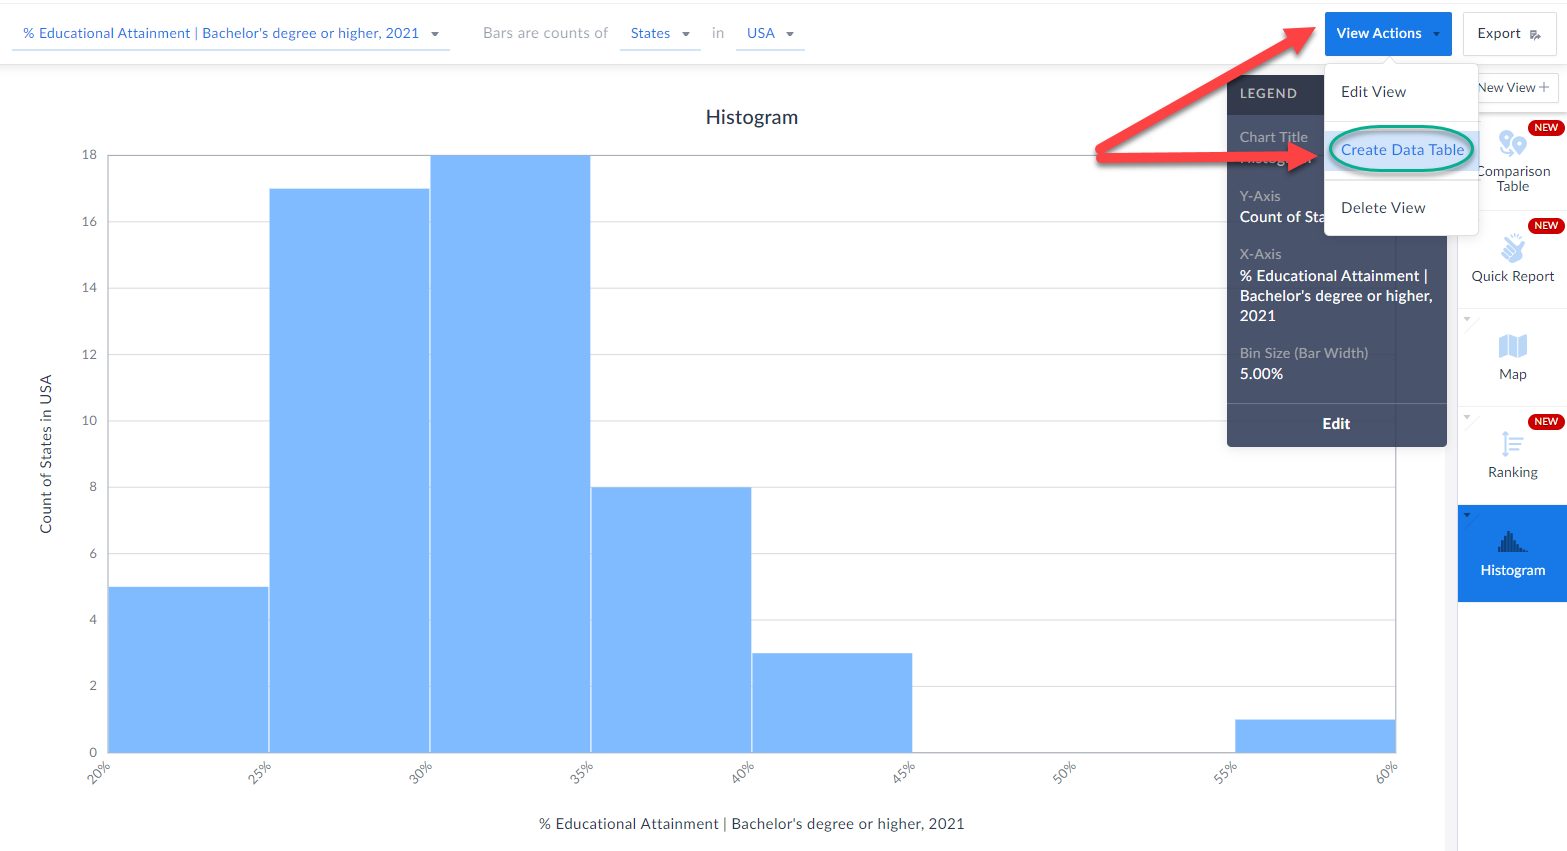
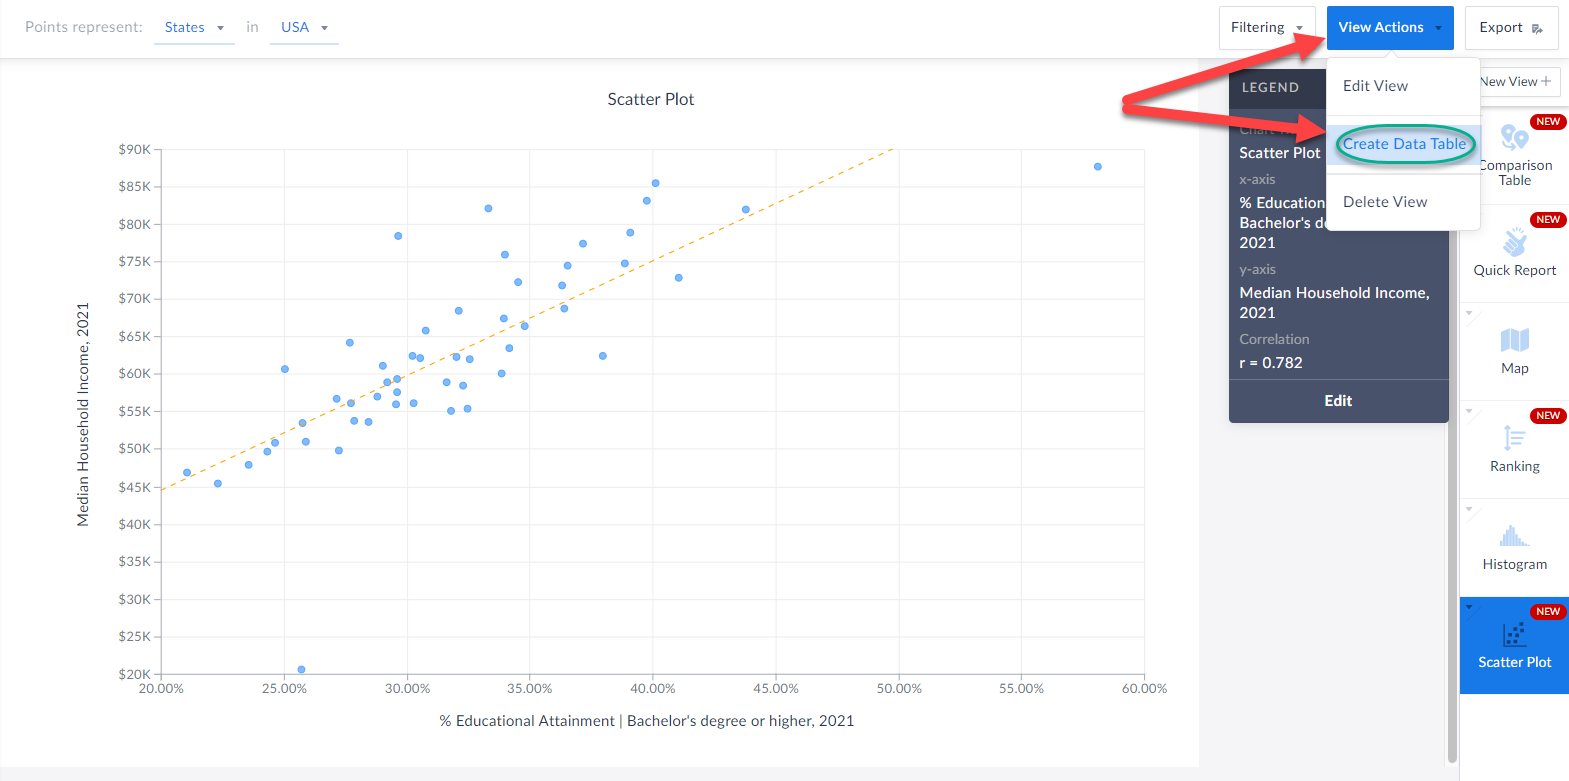
When you are in a visualization such as a map or histogram or bar chart, you are now able to instantly create a data table based on the underlying data of the visualization.
Check it out!
All you have to do is click on View Actions > Create Data Table and SimplyAnalytics will automatically generate a table for you. How cool is that?!
Create Data Table from Visualizations
We also wanted to update readers on this wonderful new feature that has flown under the radar, but is extremely useful.
When you are in a visualization such as a map or histogram or bar chart, you are now able to instantly create a data table based on the underlying data of the visualization.
Check it out!
All you have to do is click on View Actions > Create Data Table and SimplyAnalytics will automatically generate a table for you. How cool is that?!
 We hope you enjoy these new enhancements to SimplyAnalytics - thank you as always for sending us these types of suggestions for improvements, we do listen!
Have a wonderful remainder of 2021, and as always please feel free to email us at anytime at: support@simplyanalytics.com
We hope you enjoy these new enhancements to SimplyAnalytics - thank you as always for sending us these types of suggestions for improvements, we do listen!
Have a wonderful remainder of 2021, and as always please feel free to email us at anytime at: support@simplyanalytics.com
All you need to do is select the desired year(s), close out the menu/click away and voila! The new years are automatically added to your report:
Equally great is that users now have the ability to add in the other variation of your presently selected variable. For example, if you have # of adults walking to work in your report, you can immediately add in the % variation. This is also available from within the variable menu.
The percent version is now added to your report:
Create Data Table from Visualizations
We also wanted to update readers on this wonderful new feature that has flown under the radar, but is extremely useful.
When you are in a visualization such as a map or histogram or bar chart, you are now able to instantly create a data table based on the underlying data of the visualization.
Check it out!
All you have to do is click on View Actions > Create Data Table and SimplyAnalytics will automatically generate a table for you. How cool is that?!
We hope you enjoy these new enhancements to SimplyAnalytics - thank you as always for sending us these types of suggestions for improvements, we do listen!
Have a wonderful remainder of 2021, and as always please feel free to email us at anytime at: support@simplyanalytics.com
More from SimplyAnalytics
Posted on Feb 24, 2023 by Admin
We are excited to attend SCELCapalooza 2023, a three-day conference for academic and research librarians in Southern California. The Vendor Day showcase will take place on March 1st, 2023...
Posted on Aug 27, 2018 by Admin
Welcome readers! This week we are excited to feature our newest view in SimplyAnalytics, the Time Series Table.What is it?The Time Series Table allows you to quickly pull all years availa...
Posted on May 23, 2019 by Admin
Come visit the SimplyAnalytics team at the Special Library Association's Annual Conference in Cleveland. Special librarians and other information professionals come together at SLA’s annu...
Posted on Jul 30, 2018 by Admin
Hello readers! Welcome to this week’s blog. This week we will feature the Related Data Table view and how you can use it to maximize your productivity in SimplyAnalytics. What is it? The ...
Posted on Sep 28, 2018 by Admin
Welcome readers! Today we have a quick feature highlight that will assist you in browsing and searching for data variables. All data variables have a path where they reside within their d...
Posted on Sep 18, 2015 by Admin
With tens of thousands of variables available in SimplyMap, it’s common for users to wonder whether or not a particular variable they have in mind is available in SimplyMap. This is where...
Posted on May 08, 2018 by Admin
This summer's ALA conference is in New Orleans and the SimplyAnalytics team will be exhibiting at booth #837. We hope you stop by to learn about new features, check out our new data offer...
Posted on Aug 26, 2015 by Admin
Most people in the United States could probably guess which cities are popular amongst tourists - Los Angeles and New York. But can you guess how much money is spent in novelty and souven...
Posted on Jun 02, 2016 by Admin
Three weeks ago we utilized the SimmonsLOCAL data set to visualize contiguous America’s mayonnaise brand preference. Staying with the American visualization theme, this week’s report will...
Posted on Jun 25, 2015 by Admin
In this week’s SimplyMap report, we review the different options available when searching for a business. The easiest and fastest method of mapping businesses or creating a business repor...