


View Spotlight: Related Data Table
Posted on Jul 30, 2018 by Admin
Hello readers! Welcome to this week’s blog. This week we will feature the Related Data Table view and how you can use it to maximize your productivity in SimplyAnalytics.
What is it?
The Related Data Table View is designed to allow you to quickly add in many similar data variables at once. For example, if you add "% Households w/ Income $50,000 to $74,999" the report will also show all of the other income ranges as well.
Some other use cases: you want to quickly add in all life-stage data variables, or PRIZM psychographic segments, or all Language variables.
Example
Identify what the top PRIZM household segment is for a ZIP Code. The PRIZM Dataset is a marketing segmentation system that allows you to understand the demographic and lifestyle/consumer traits of any location in the United States. This data is very popular within marketing departments across many large companies, and we are happy to offer it as an add on module to your subscription.
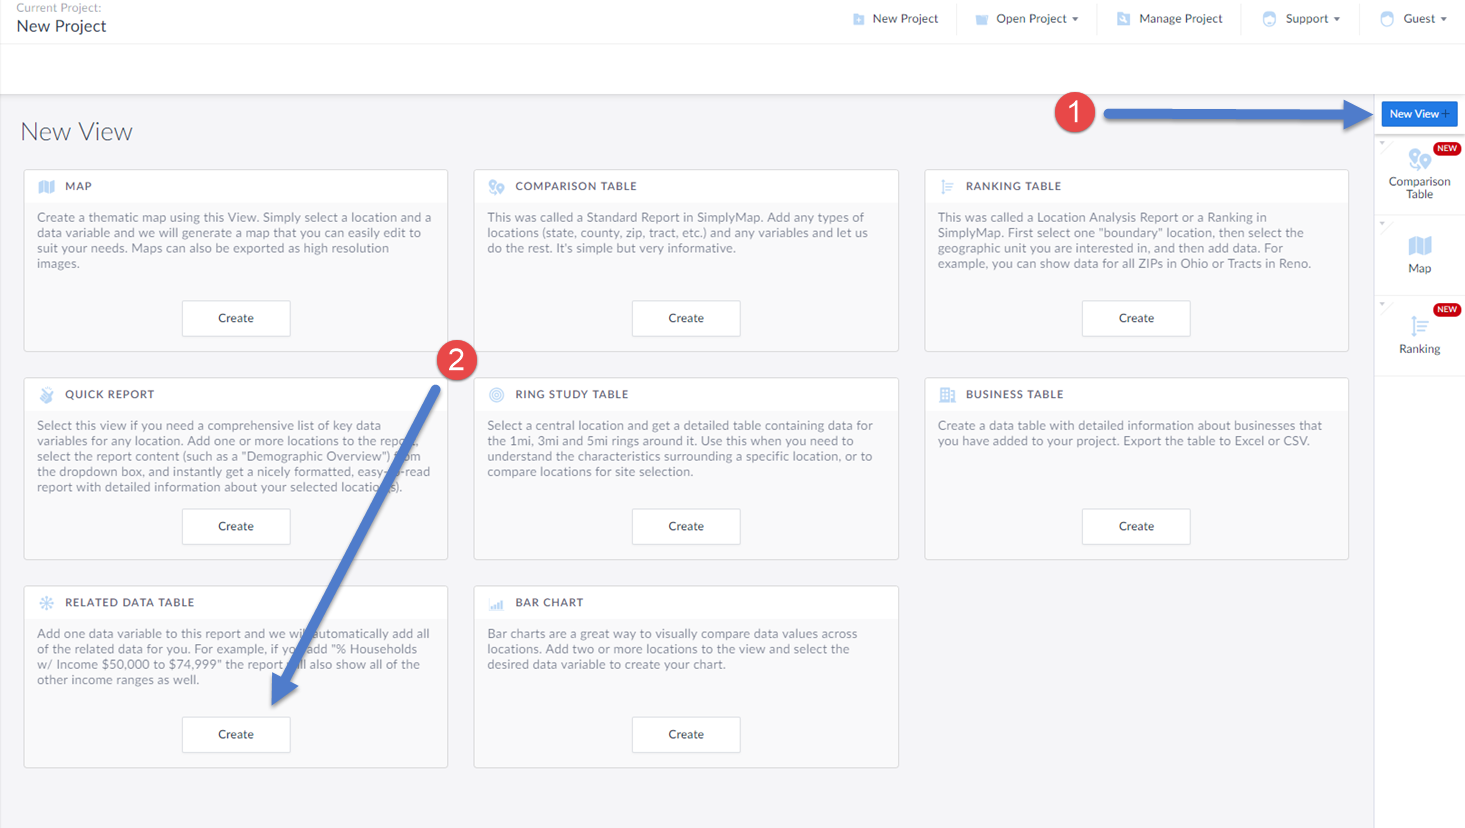
(1) Select New View from the top-right of the interface
(2) Click on the Create button under the Related Data Table section
This will open up the Edit Related Data Table screen. This is where you add in your location, and data variable. In this example, we will select a random PRIZM Premier segment. Keep in mind, this report will add in all of the segments for you.
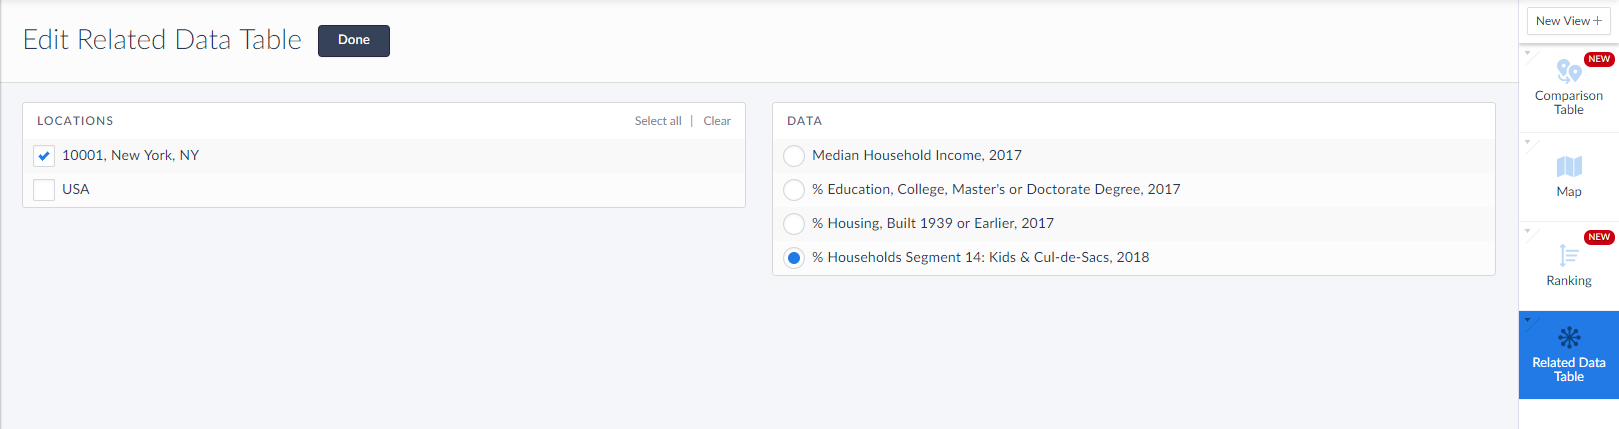
Select Done once the location and data variable have been added, and the report will generate.
Click on the Location/column header to sort either Ascending or Descending. It looks like the ZIP Code 10001 in New York is largely classified as Connected Bohemians.
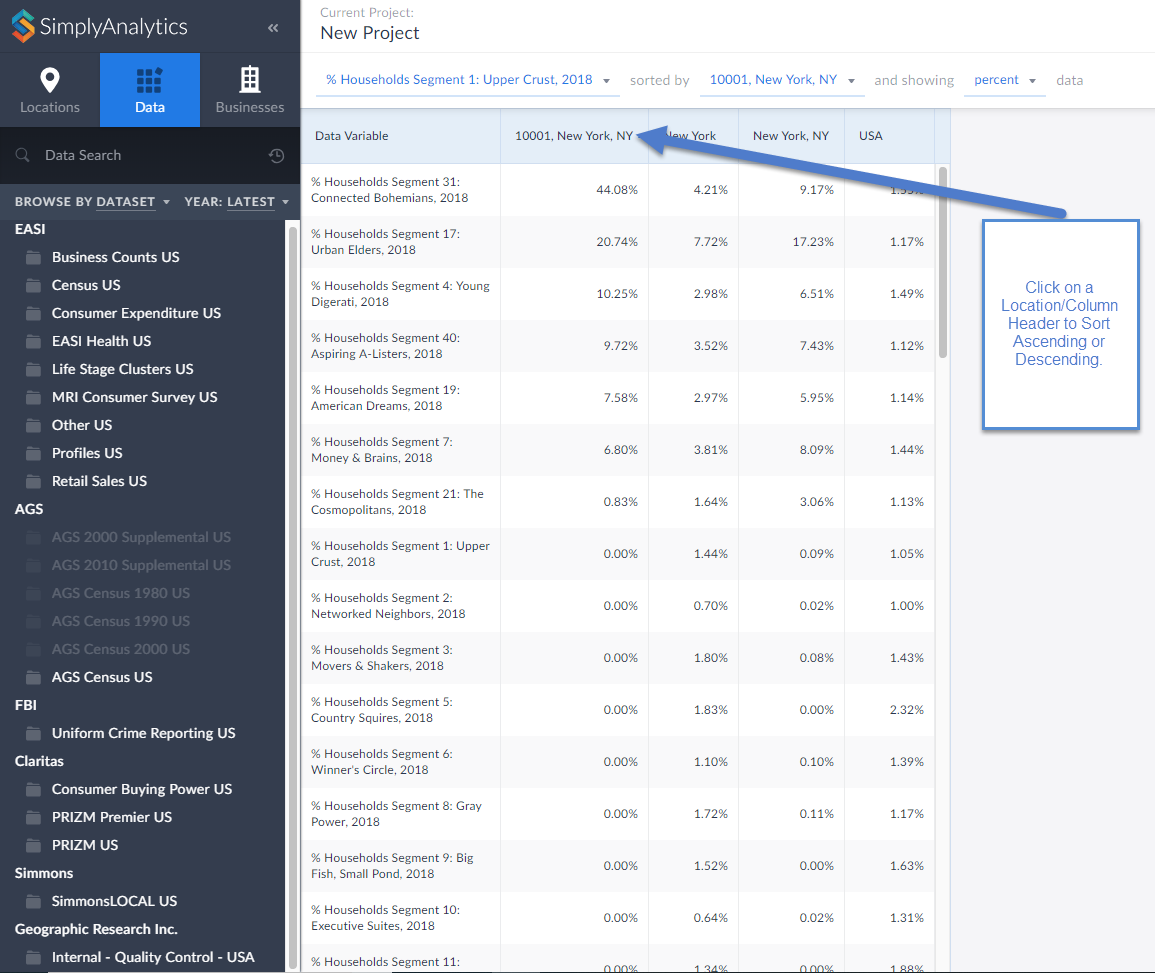
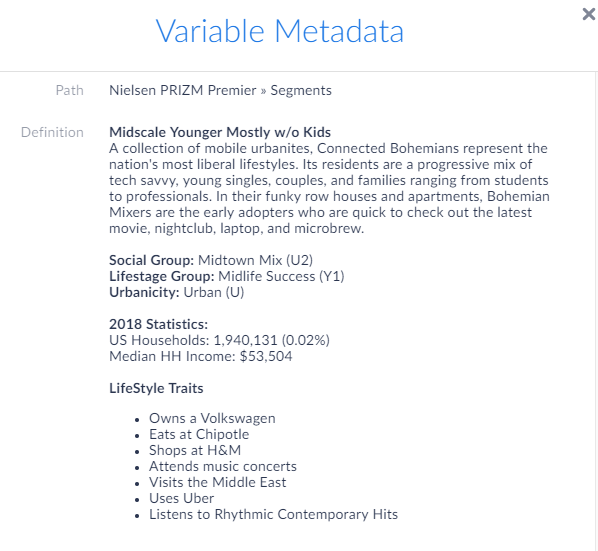
Click on the variable title to view the Metadata and learn more about this segment.
Interesting stuff! If your organization is interested in having a trial or webinar of the PRIZM dataset featured here, feel free to reach out to: support@simplyanalytics.com
More from SimplyAnalytics
Posted on Sep 21, 2009 by Admin
The North Carolina Library Association will hold its annual conference in Greenville, NC at the Greenville Convention Center from October 6-8, 2009. Geographic Research, Inc. will be exhi...
Posted on Apr 30, 2020 by Admin
We find ourselves in the middle of an unprecedented crisis the likes of which most of us have never experienced before, and hopefully won’t have to experience again. There is the occasion...
Posted on Nov 06, 2013 by Admin
SimplyMap includes a number of helpful support tools; guided wizards available when and where you need them, detailed help files, and an online support center with FAQs and searchable kno...
Posted on Dec 06, 2009 by Admin
ALA's Choice Magazine, publisher of independent reviews of products and services for academic libraries, released a new review of SimplyMap in the December 2009 edition. The reviewer, Car...
Posted on Jan 18, 2008 by Admin
The BRASS Business Reference Sources Committee of Reference & User Services Quarterly (RUSA) selected SimplyMap as one of the Outstanding Business Reference Sources for 2007. Excerpt...
Posted on Sep 07, 2011 by Admin
Geographic Research will be exhibiting and presenting during a vendor showcase session at the upcoming North Carolina Library Association (NCLA) Biennial Conference, October 4-7, 2011 in ...
Posted on Dec 07, 2021 by Admin
Hello readers! We hope you are enjoying the holiday season as much as we are. Today, we are happy to announce a couple of improvements to SimplyAnalytics designed to help you get your res...
Posted on Sep 15, 2016 by Admin
While creating a radius location is the fastest and easiest method for creating a custom location, there may be situations that require a more specific and targeted locale. Let’s say for ...
Posted on Nov 11, 2013 by Admin
Chad Boeninger, Business & Economics Subject Specialist at Ohio University Libraries has produced some excellent tutorial videos to help students learn how to analyze data and create ...
Posted on Jan 18, 2009 by Admin
Michigan State University is offering their users a basic introduction to using SimplyMap. The 1.5 hour session will cover the basics of how to use SimplyMap to create maps and reports u...