 Go up
Go up


Exploring SimplyMap Data: ConneXions® from Nielsen
Posted on Jul 22, 2015 by Admin
In this week’s SimplyMap report, we take a look at one of our newly available data packages - ConneXions® from Nielsen. The ConneXions® segmentation system integrates consumer behavior and usage measures for technology, voice, video and data services with demographics and lifestyle characteristics. ConneXions® enables communications service providers, consumer durables manufacturers, and other companies focused on technology adoption a way to cost-effectively and efficiently retain existing customers, while continuing to acquire new ones.
To give you an idea of these segments, we’ll rank some cities from the US and view each of the top segment’s metadata. Let’s get started!
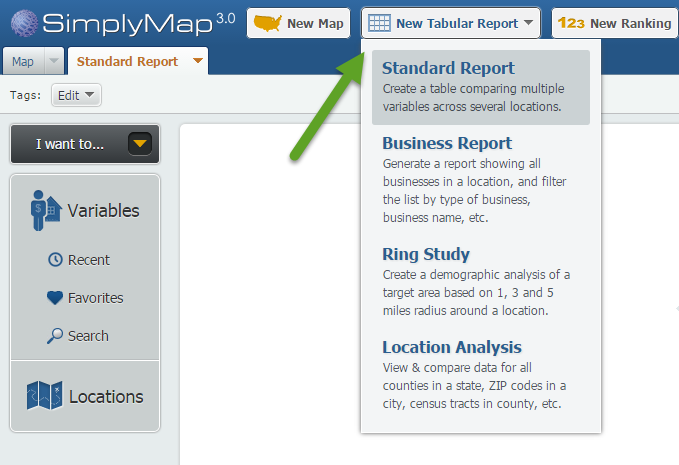
Step 1: Create a Standard Report by selecting New Tabular Report > Standard Report.
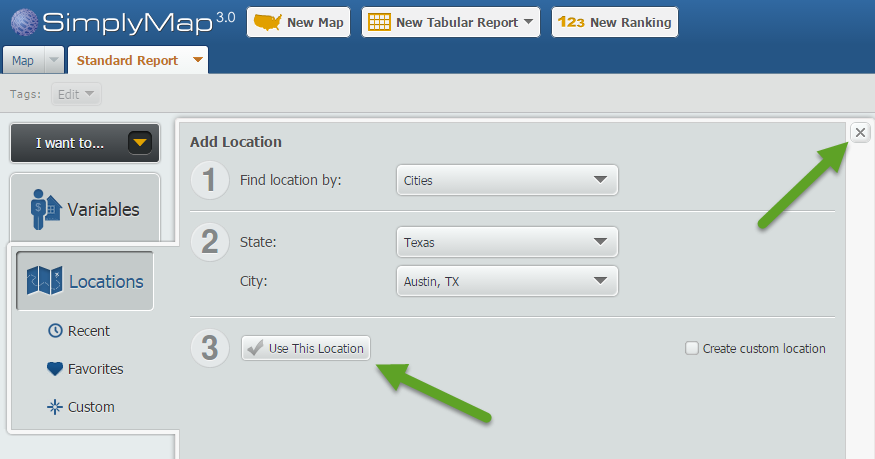
Step 2: Choose a location from the Locations panel - in this example, we will first use Austin, TX as our location. Close out the Locations panel.
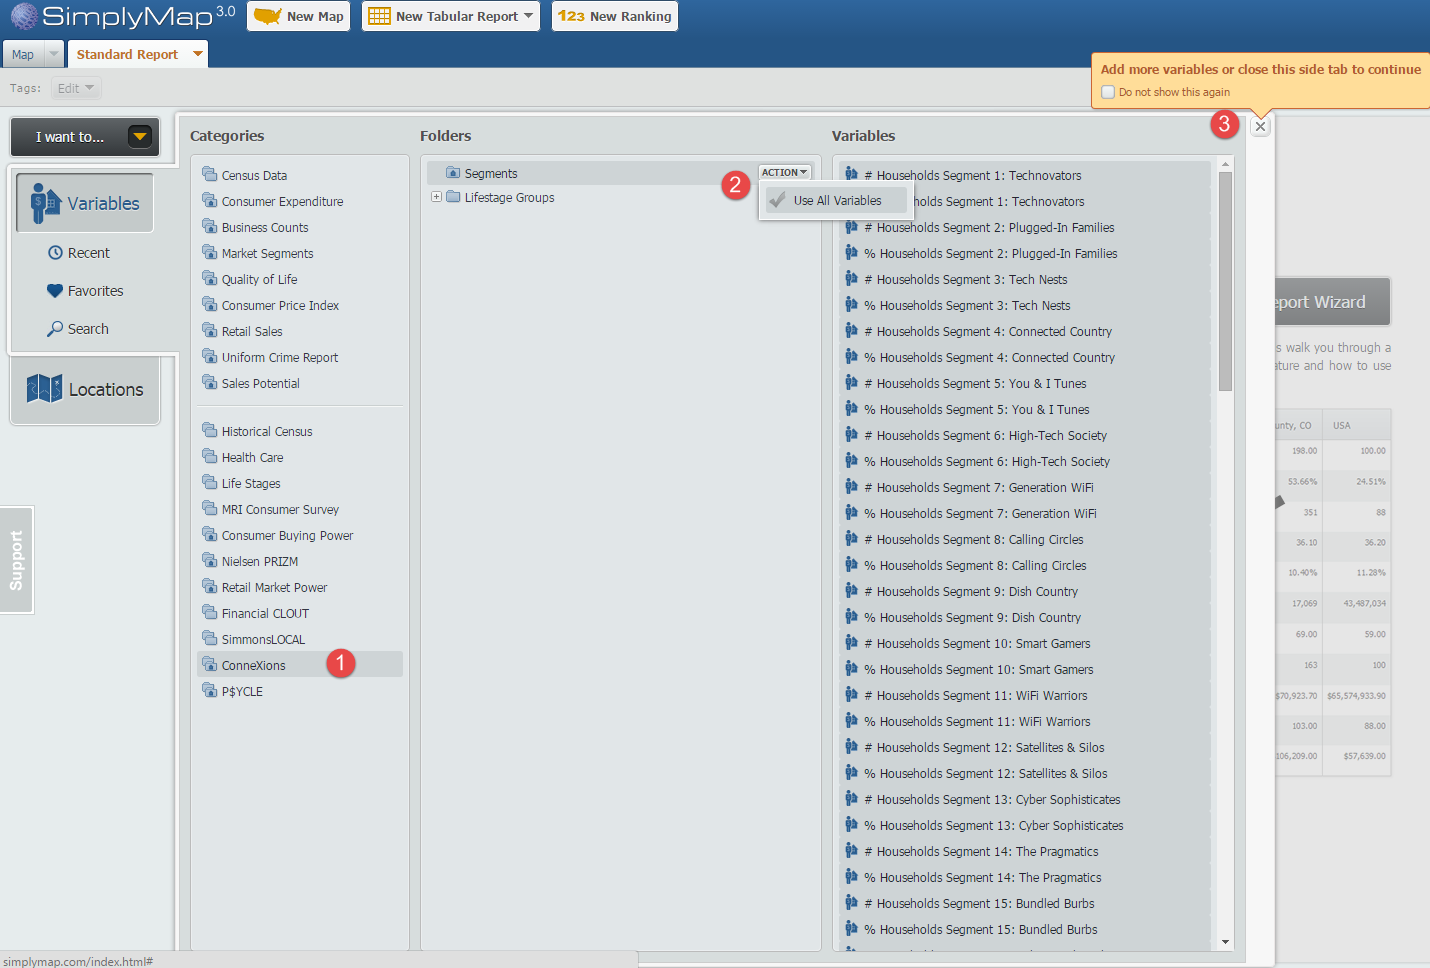
Step 3: Click on the Variables panel and select the ConneXions® folder. Click on Segments and select “Use All Variables” from the Actions dropdown. Close out the Locations panel to generate your report.
Step 4: To view the highest segment in the city of Austin, hover over the city and select Sort Descending from the actions dropdown that appears.
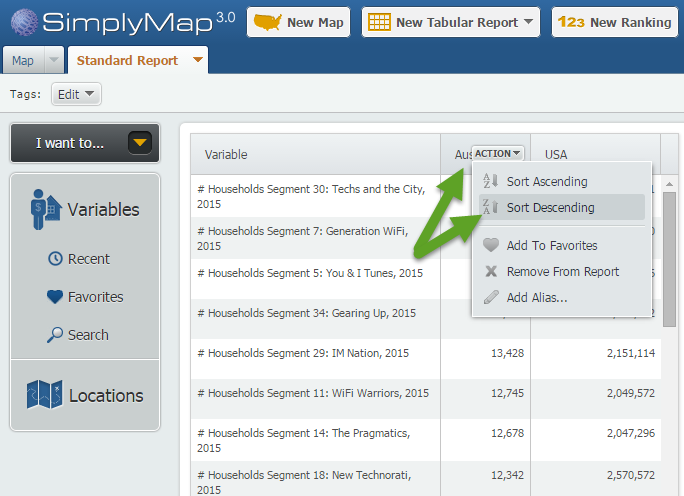
It looks like the largest segment for Austin is Segment 30: Techs and the City. To read about the segment, hover over the variable and select “View Metadata” - below is an excerpt of this segment’s metadata:
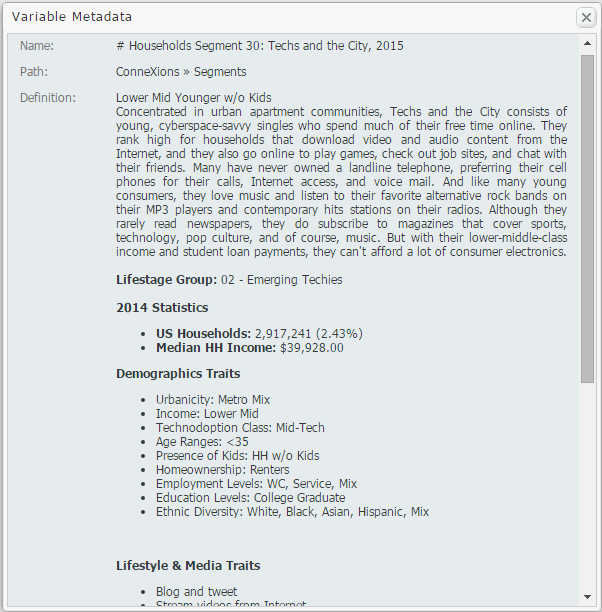
We repeated the process for the cities of Miami and Atlanta to see what their top segments were. Atlanta had a similar result to Austin, with "You & iTunes" as the top segment, but Miami's "Last to Adopt" segment was most prevalent, reflecting an older average population. Log in to SimplyMap to run your own local analysis - share your results in the comments!
We hope you enjoyed this week’s SimplyMap report. Don’t forget to follow us on Twitter and Like Us on Facebook to keep up to date on all things SimplyMap.
If the institution you are associated with subscribes to SimplyMap and would like a free trial of this data module, please feel free to email: support@geographicresearch.com with your request.
More from SimplyAnalytics


Posted on Jan 23, 2024 by Admin
We are excited to again make the trip to Los Angeles for SCELCapalooza 2024 hosted at Loyola Marymount University! Please drop by our table on Wednesday, Feb. 28th to learn more about Sim...
Posted on Jun 07, 2011 by Admin
We will be exhibiting at the Special Library Association Annual Conference in Philadelphia and the American Library Association conference in New Orleans later this month. Come and visit ...
Posted on Jul 09, 2015 by Admin
In this week’s SimplyMap report, we set out to find which cities have the highest percentages of people who use their bike as their mode of transportation to work in the US. Let’s get sta...
Posted on May 19, 2016 by Admin
Drop by booth #215 at the SLA 2016 conference to chat with us and get the latest info on SimplyMap. We look forward to seeing our customers, friends, and all others interested in learning...
Posted on May 16, 2022 by Admin
Hello readers! We hope you are having a wonderful day. Today we feature a question from the help desk that we think many users would find useful. Let’s get started. The question: How can ...
Posted on Nov 19, 2019 by Admin
Hello readers! Today we are bringing you a new blog entry inspired by a recent Help Desk question. If you ever have any questions about SimplyAnalytics, please do not hesitate to reach ou...
Posted on Jun 21, 2022 by Admin
Hello readers! We hope you’re having a great day. Today we are featuring 5 commonly asked questions about the American Community Survey dataset that’s available to all customers in Simply...
Posted on Apr 30, 2024 by Admin
Congratulations to Brandyn Whitaker as the recipient of the 2024 BRASS Student Travel Award! Brandyn is a Library Services Associate in the Workforce and Economic Development department a...
Posted on Feb 21, 2018 by Admin
We are looking forward to attending our first Electronic Resources & Libraries (ER&L) conference in Austin, TX! Visit us at Table #510 for a closer look at SimplyAnalytics – the b...
Posted on May 18, 2015 by Admin
The SimplyMap team is looking forward to visiting with customers and others at the SLA Annual Conference, coming to Boston on June 14-16. Come visit us at Booth #916, we are happy to answ...