


View Spotlight - Time Series Table
Posted on Aug 27, 2018 by Admin
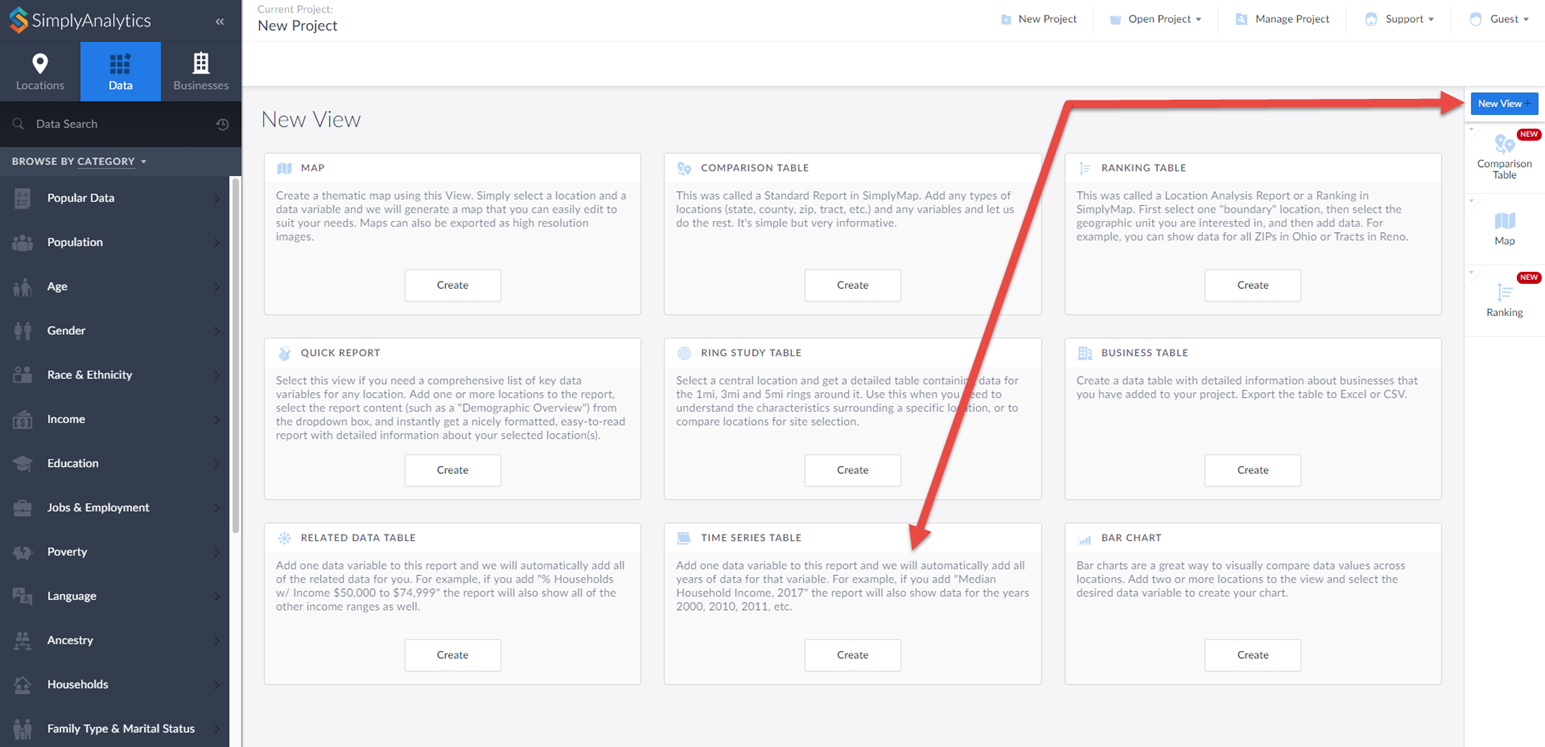
Welcome readers! This week we are excited to feature our newest view in SimplyAnalytics, the Time Series Table.What is it?The Time Series Table allows you to quickly pull all years available for a variable of your choosing. This allows you to easily identify trends over time.ExampleYou want to track the trend of median household income across some target locations.In your project, select New View towards the top-right of your screen and select Time Series Table.
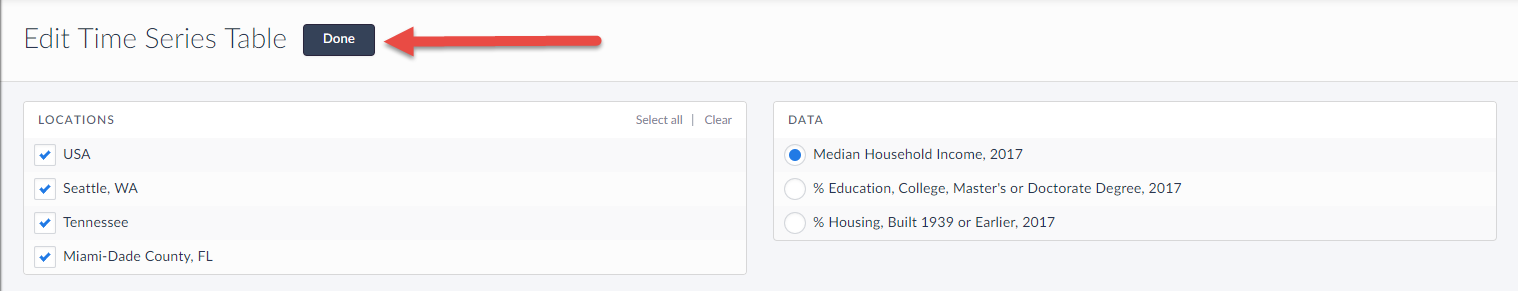
This opens up the Edit View screen. Specify Median Household Income and the locations you want to view the trends for. Click on Done to generate your table.
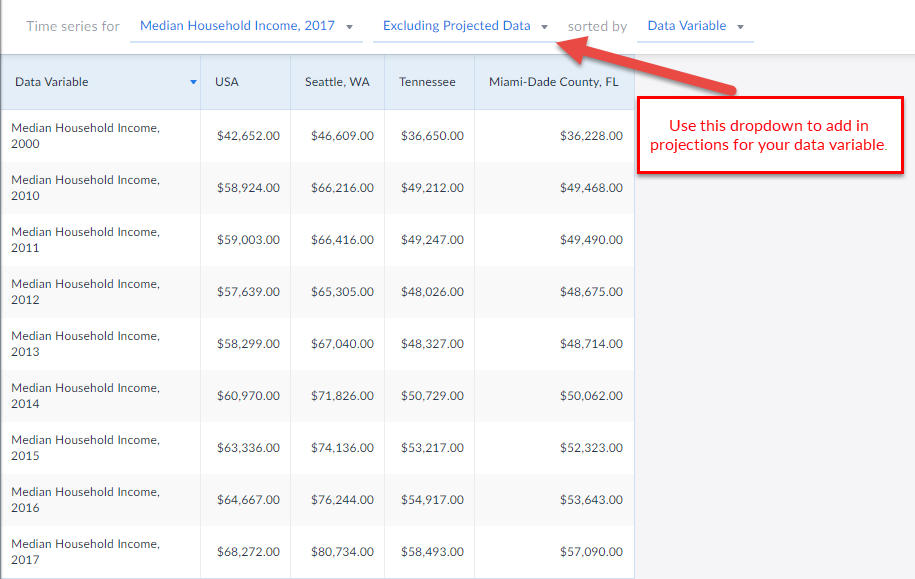
 And that’s all there is to it! You can use the dropdowns to change variables or add in projections for that data variable.
 We hope you’re as excited as we are about this new view - let us know if you have any questions or suggestions for future features or blogs.
More from SimplyAnalytics
Posted on Jul 09, 2015 by Admin
In this week’s SimplyMap report, we set out to find which cities have the highest percentages of people who use their bike as their mode of transportation to work in the US. Let’s get sta...
Posted on Oct 24, 2014 by Admin
At times it can be useful to apply filters to the data in SimplyMap as a means of focusing on specific characteristics, or preforming a query. For example, a map showing household income ...
Posted on Apr 05, 2019 by Admin
Come visit the SimplyAnalytics booth (325) at the upcoming ACRL 2019 show in Cleveland! Say hello, grab a chocolate, and stay for a quick demo of SimplyAnalytics. The team will be showcas...
Posted on Mar 18, 2015 by Admin
Can you guess which US city has the most residents per square mile? Today we’re going to use SimplyMap to answer this question for all cities, as well as cities with a population greater ...
Posted on May 02, 2016 by Admin
Inspired by a recent support desk question, this week’s SimplyMap report will demonstrate how a user would run a business search that consists of multiple names. In short, the user was at...
Posted on Sep 27, 2019 by Admin
Hello readers! This week we provide an in-depth response to a question asking about the legend classification methods in SimplyAnalytics. This response is now part of our Help Center: htt...
Posted on Feb 21, 2018 by Admin
We are looking forward to attending our first Electronic Resources & Libraries (ER&L) conference in Austin, TX! Visit us at Table #510 for a closer look at SimplyAnalytics – the b...
Posted on Nov 22, 2016 by Admin
We will be exhibiting at ALA Midwinter in Atlanta, Georgia in January. You can find the GRI team at Booth 1155, where we will be catching up with customers old and new, and sharing some e...
Posted on May 26, 2020 by Admin
Hello readers! We hope you are doing well, and thank you for your continued support of SimplyAnalytics. We are excited to announce that scatterplots are officially live! Scatter plots ar...
Posted on Jul 30, 2008 by Admin
Cornell’s Albert R. Mann Library has subscribed to SimplyMap. They provide some tips and access to the SimplyMap Quick Reference Guide, variable list, and some information on the EASI dat...